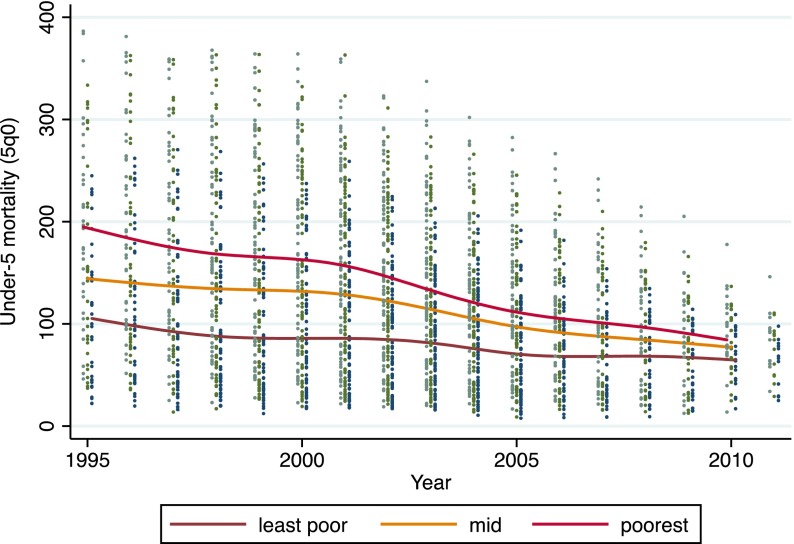
FIGURE 1.
Under-5 mortality (5q0) among the poorest, middle, and least-poor tertiles estimated annually up to 10 years before the year of the survey (starting in 1995) in 85 surveys. The scatter represents the annual estimates in each year in each tertile (poorest is the left-most column of dots). Smoothed median spline curves fit to each wealth tertile’s data show the convergence in mortality. Under-5 mortality in the highest mortality groups, mostly the poorest, approached 400 per 1000 live births in the 1990s and declined precipitously.

