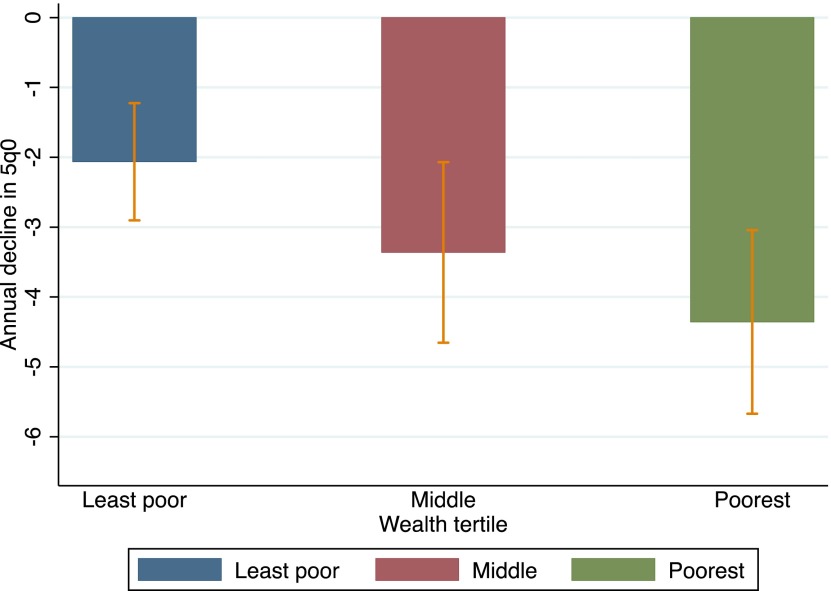
FIGURE 2.
Average annual decline of under-5 mortality (5q0) by wealth tertile in 29 countries with repeated DHS surveys (and 95% CI bars). Only the first and most recent surveys of countries with repeat surveys were used in this analysis. The absolute annual declines in 5q0 were greatest in the poorest tertile and smallest in the least poor.

