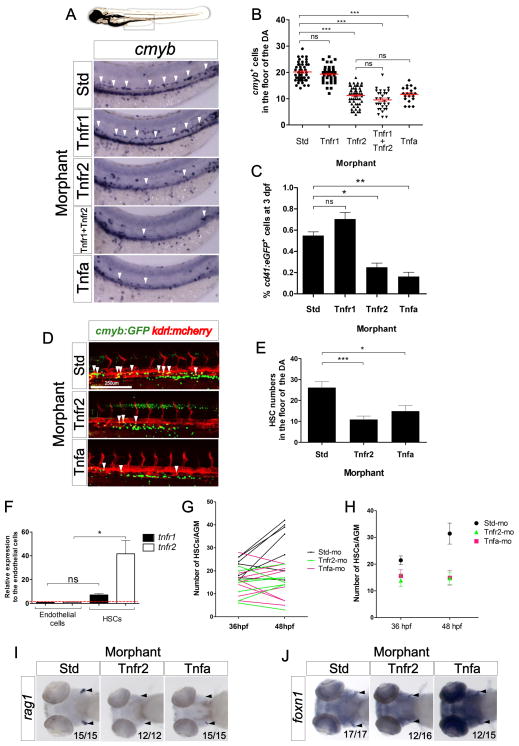
Figure 1. Tnfa and Tnfr2 are required for HSC generation.
(A) Standard control (Std), Tnfr1, Tnfr2, Tnfa, and Tnfr1 and Tnfr2 morphants were examined by WISH for cmyb expression in the aortic floor at 48hpf. White arrowheads denote cmyb+ HSPCs. (B) Quantification of cmyb+ HSPCs from (A). Each dot represents total cmyb+ cells per embryo. The mean ± S.E.M. for each group of embryos is shown in red. (C) cd41:eGFP transgenic embryos were injected with Std, Tnfr1, Tnfr2, and Tnfa MOs and subjected to flow cytometric analysis at 3dpf. Each bar represents the percentage of cd41:GFP+ cells in each sample and is the mean ± S.E.M of 3–7 independent samples of 5 embryos each. (D) Maximum projections of 48hpf cmyb:eGFP; kdrl:memCherry double transgenic embryos injected with Std, Tnfr2, and Tnfa MOs. Arrowheads denote cmyb+, kdrl+ HSCs along the DA. All views: anterior to left. (E) Enumeration of cmyb+, kdrl+ HSCs shown in (D). Bars represent mean ± S.E.M of Std (n=13), Tnfr2 (n=13), and Tnfa (n=8) morphants. (F) cmyb−, kdrl+ endothelial cells and cmyb−, kdrl+ HSCs were isolated from cmyb:GFP; kdrl:mcherry transgenic fish by FACS at 48hpf and examined for expression of tnfr1 and tnfr2. Bars represent means ± S.E.M. of two biological replicates. (G) Confocal tracking of HSC numbers in the floor of the DA from individual cmyb:eGFP; kdrl:mcherry transgenic animals at 36 and 48 hpf following depletion of Tnfr2 or Tnfa compared to standard control morphants. (H) Means ± S.E.M. of cmyb+ cell numbers from (G). (I–J) WISH for the T lymphocyte and thymic epithelial markers rag1 (I) and foxn1 (J) (black arrowheads), respectively, in Tnfr2 and Tnfa morphants compared to Std controls at 4 dpf. All views are ventral, with anteriors to left. Numbers represent embryos with displayed phenotype; ns, not significant; *p<0.05, **p<0.01, ***p<0.001. See also Supplementary Figure 1.

