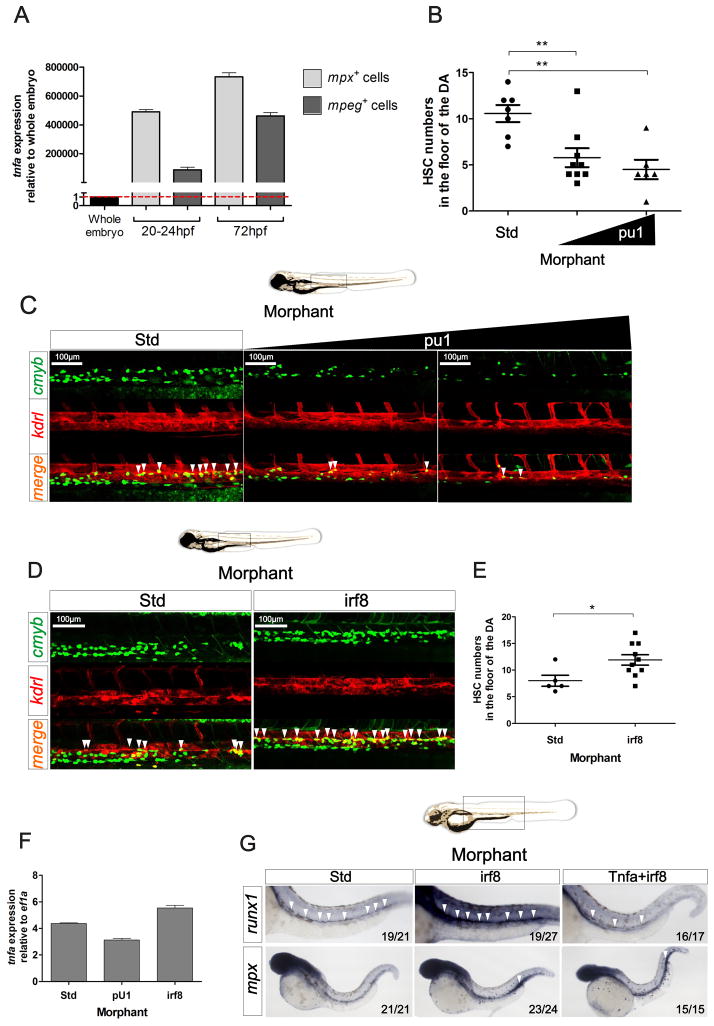
Figure 7. Primitive myeloid cells play a key role in HSC specification.
(A) Primitive neutrophils (mpx:GFP+) and macrophages (mpeg:GFP+) were isolated at 20–24 and 72 hpf by FACS and tnfa expression was quantified by qPCR. Expression was normalized to ef1a and is presented relative to whole embryo expression. Bars represent means ± S.E.M. of two independent experiments. (B) Enumeration of cmyb+; kdrl+ HSCs shown in (C). (C) Maximum projections of representative images of cmyb:eGFP; kdrl:m Cherry embryos at 48hpf following injections of Std or pU.1 MOs, the latter at two different concentrations. Region shown is the DA, and arrowheads denote cmyb+; kdrl+ HSCs. (D) Maximum projections of representative images of cmyb:eGFP; kdrl:memCherry embryos at 48hpf in Std and irf8 morphants. Arrowheads denote cmyb+; kdrl+ HSCs. (E) Enumeration of cmyb+; kdrl+ HSCs shown in (D). (F) tnfa expression relative to ef1a in 28hpf Std, pU.1 or irf8 morphants. Bars represent means ± S.E.M of duplicate samples. (G) Std, irf8, and irf8+Tnfa morphants were interrogated by WISH for runx1 and mpx at 28hpf. All views are lateral, with anteriors to the left. Numbers represent larvae with indicated phenotypes. *p<0.05; ***p<0.001. See also Supplementary Figure 5.

