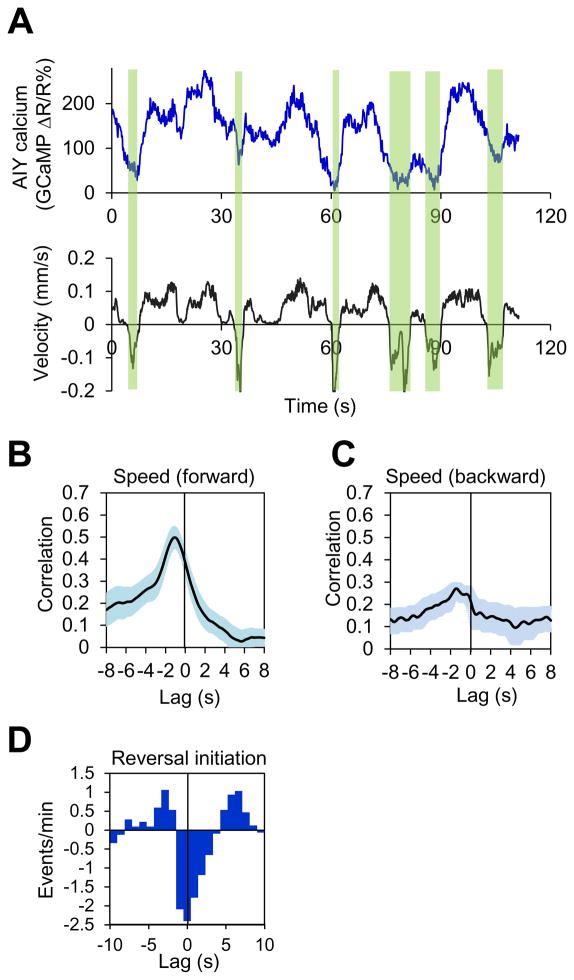
Figure 2. The calcium activity pattern of AIY correlates with locomotion speed and direction-switch in freely-behaving worms.
(A) Calcium and locomotion velocity traces acquired with the CARIBN system. The windows highlighted in green denote reversals.
(B–C) Cross-correlation analysis shows that AIY calcium activity correlates with forward but not backward locomotion speed. The shades along the curves represent error bars (SEM). n=8.
(D) Cross-correlogram showing that reversal initiation correlates with AIY activity decrease. Since reversal initiation occurs in an all-or-none fashion, cross-correlogram was used to analyze correlation using a method similar to that reported previously (Brown et al., 2004). The occurrence of a reversal event and the decrease/increase in calcium level at a given time point were analyzed for correlation. A negative value indicates that a reversal event coincided with a decrease in calcium level, and vice versa.
Also see Figure S2 and Supplemental Movie 1.

