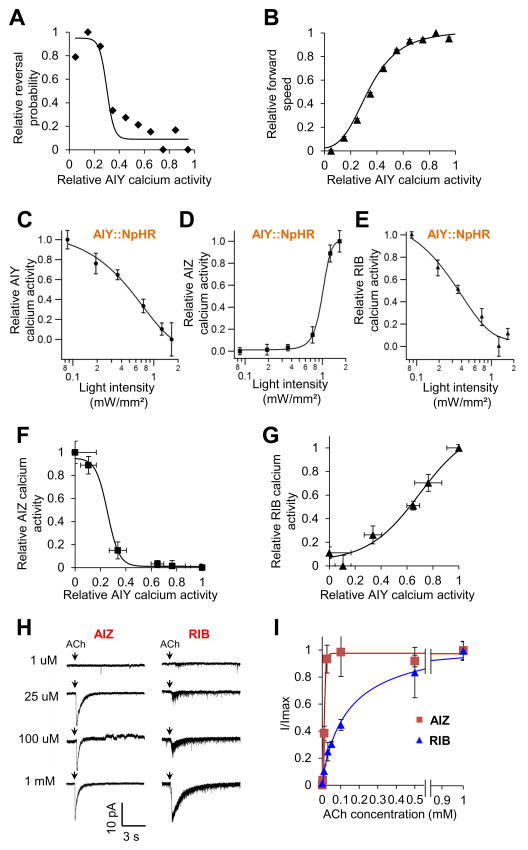
Figure 7. Differential processing of AIY signals by the AIY-AIZ and AIY-RIB synapses.
(A–B) The input-output relations between AIY activity (input) and reversal initiation (output) or locomotion speed (output). We analyzed the data from AIY calcium imaging and behavioral traces obtained with the CARIBN system (e.g. Figure 2A). AIY calcium data points were extracted from the CARIBN traces, normalized, and binned into ten groups (bin width: 0.1). Reversal probability and locomotion speed was tabulated for each group based on the data from the behavioral traces, normalized, and plotted as a function of the relative AIY calcium activity of individual groups to make (A) and (B), respectively. Both data were fit with a sigmoidal equation: . X1/2 represents the X value where Y shows 50% of its maximal value. slope describes the steepness of the curve.
(C–E) Calcium responses in AIY, AIZ and RIB triggered by optogenetic tuning of AIY activity. Freely-behaving worms carrying separate transgenes, which expressed NpHR in AIY (i.e. AIY::NpHR) and GCaMP3 in AIY, AIZ and RIB, were challenged with varying intensities of yellow light to tune the activity of AIY. Both the presynaptic calcium activity in AIY and the postsynaptic calcium responses in AIZ and RIB were recorded with the CARIBN system. The resulting calcium activities in AIY, AIZ and RIB were normalized and plotted as a function of yellow light intensities. (C) AIY calcium response curve. (D) AIZ calcium response curve. (E) RIB calcium response curve. n ≥4.
(F–G) The input-output relations of the AIY-AIZ and AIY-RIB synapses. Data in (C–E) were re-plotted to derive the input-output relations of the two synapses. Specifically, the relative AIZ and RIB calcium activity values (output) shown in (D) and (E) were re-plotted as a function of the relative AIY calcium activity values (input), which were shown in (C), to generate (F) and (G), respectively. Both data were fit with a sigmoidal equation: .
(H–I) The postsynaptic ACh receptors in AIZ and RIB show distinct biophysical properties. (H) Sample traces of AIZ and RIB whole-cell currents evoked by different concentrations of ACh. Voltage: −60 mV. (I) ACh-gated currents in AIZ and RIB were plotted as a function of ACh concentrations. Data were fit with a Hill equation: , where n represents Hill slope (Hill coefficient).
All error bars: SEM.

