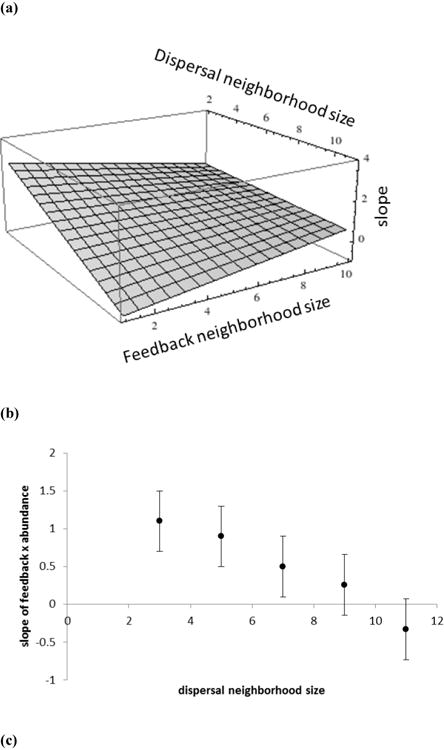
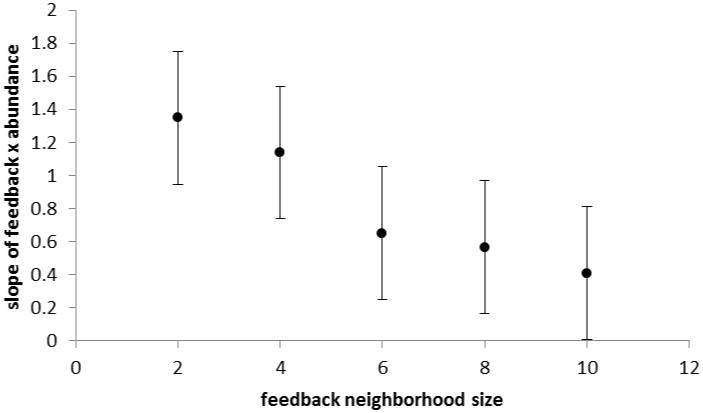
Fig 1.


The relationship between dispersal and feedback neighbourhood size and the slope of the relationship between feedback and abundance. (a) The interaction effect between the size of dispersal and feedback neighbourhoods on the mean slope of the correlation between average feedback and relative log-abundance. The plane plotted represents estimates derived from the statistically significant regression model. (b) Mean slope of the correlation between average feedback and relative log-abundance as a function of the radius of the dispersal neighbourhood measured in cells between the focal cell and the maximum dispersal distance. (c) Mean slope of the correlation between average feedback and relative log-abundance as a function of the radius of the dispersal neighbourhood measured in cells between the focal cell and the maximum dispersal distance. Points are the least square means from a GLM analysis and bars represent standard errors for the model.
