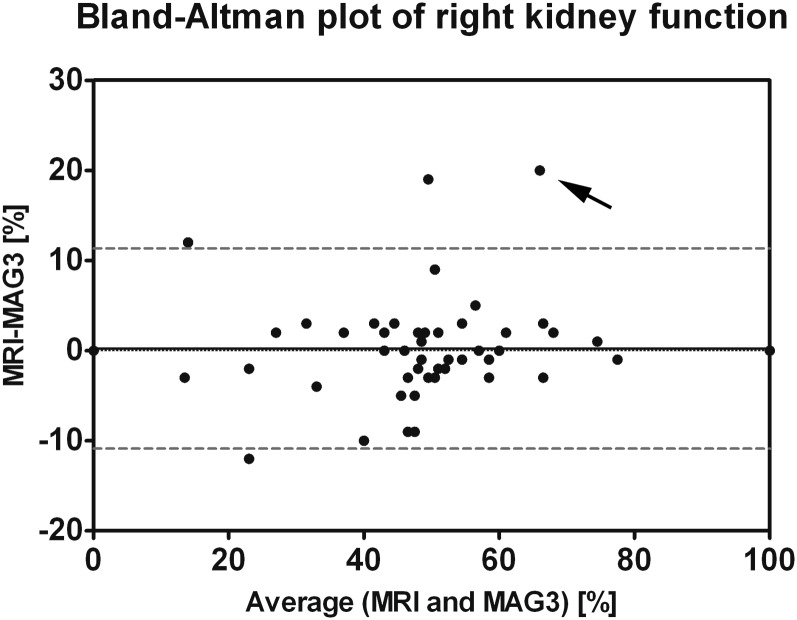
Figure 4.
Bland–Altman plot of right kidney function for MR nephrography and mercaptoacetyltriglycine (MAG3) scintigraphy. Mean (0.23%) and 1.96 × standard deviation (5.7%) of the paired differences are indicated by solid and dashed lines, respectively. All measurement points, except four, are within ±1.96 standard deviations of the mean paired difference. In the measurement point with the strongest deviation between MAG3 and MR functions (arrow, case of Figure 5), impaired left kidney function was found in MR nephrography with normal kidney function in MAG3 scintigraphy. This finding may potentially be attributed to an earlier impairment of glomerular filtration (measured with GD-DTPA) as compared with tubular function (evaluated with MAG3).

