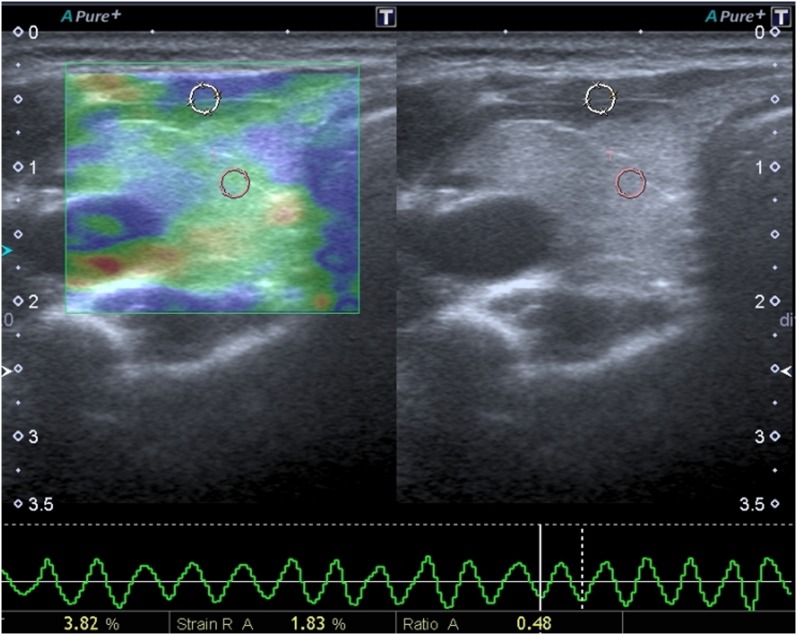
Figure 1.
The elastography calculation of thyroid parenchyma. Left side of the windows is colour-coded elastography image and the right side is greyscale image. The circles indicate the regions of interest where we measured the stiffness ratios. One is on the strap muscle and one is on the normal thyroid parenchyma. At the bottom of the screen, normal sinusoidal wave can be seen. It indicates pressure of the probe is appropriate and regular. The numbers indicate the strain values, and “%” indicates the strain ratio.

