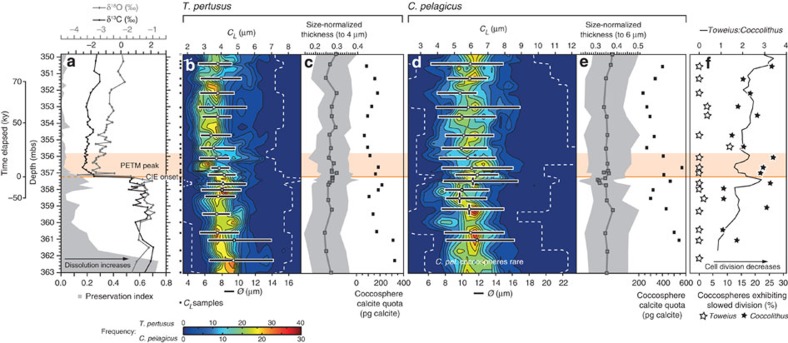
Figure 1. Stable isotope, coccolith preservation and morphometric records at Bass River, New Jersey.
(a) Bulk carbon (black squares) and bulk oxygen isotopes (grey diamonds; data from John et al.21) with a quantitative nannofossil preservation index (data from Gibbs et al.38; grey shading). Time from the initial carbon isotope excursion (CIE) is indicated (kyrs; following John et al.21), as are depths from which coccolith length (CL) measurements were collected (black squares). (b,d) Frequency data for coccolith lengths (CL; totalling 3,200 and 3,050 measurements for T. pertusus and C. pelagicus, respectively) are interpolated to equal depth steps of 10 cm, with minimum and maximum size-bins (dashed line). Mean coccosphere diameters (Ø; white squares) with 5th and 95th percentiles of each population (horizontal black bars) and the sampling interval (vertical black bars) are shown, calculated from a total of 507 and 375 coccospheres for Toweius and Coccolithus, respectively. (c,e) Mean coccolith size-normalized thickness for T. pertusus and C. pelagicus (dark grey squares), with the 5th and 95th percentiles of each sample (grey shading). Uncertainty on mean size-normalized thickness is calculated as two s.d.s across the bootstrap results at the length to which thickness is being normalized and does not exceed ±0.008 μm. Mean coccosphere calcite quotas are shown (black squares). (f) The percentage of each population that exhibits coccosphere geometry typical of slowed cell division (early stationary growth phase, see ref. 11; open stars for T. pertusus and closed stars for C. pelagicus) and the ratio of T. pertusus to C. pelagicus coccoliths (black line). The onset of the CIE (orange line) and interval of peak warmth during the PETM (orange shading) are indicated (following John et al.21).

