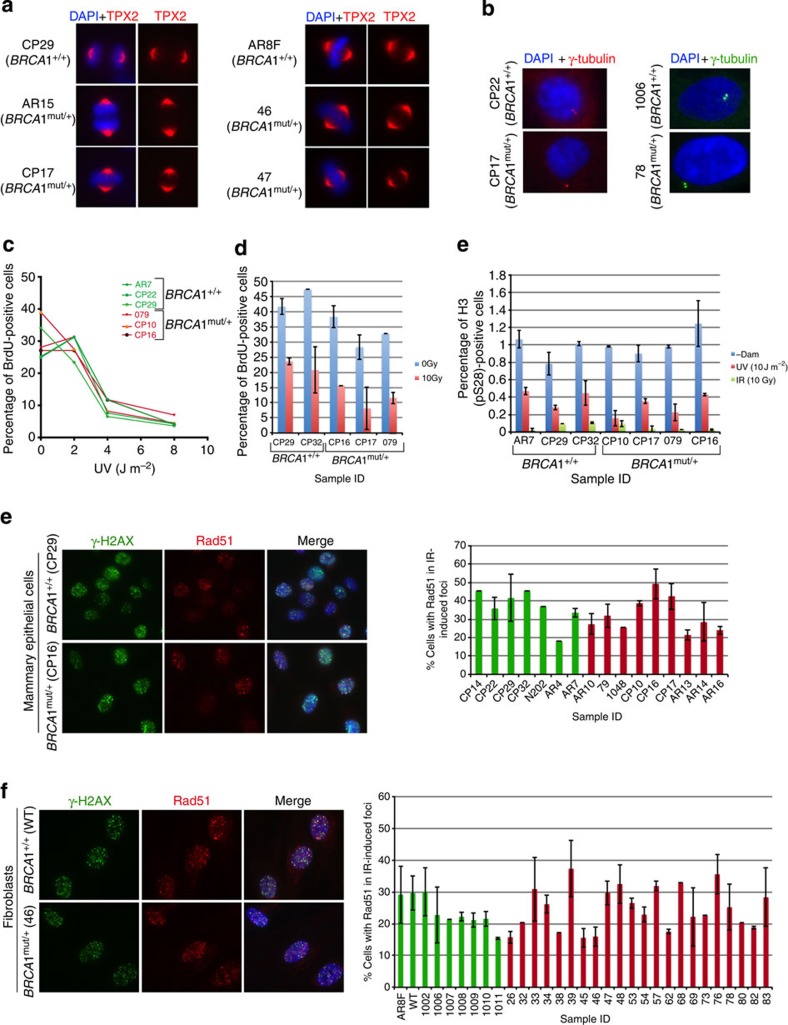
Figure 2. Spindle pole formation, centrosome number, checkpoint activation and Rad51 recruitment to DSB.
(a) Representative images of HMECs (left panel) and skin fibroblasts (right panel), from BRCA1mut/+ and BRCA1+/+ were immunostained with an anti- TPX2 Ab to detect spindles; n=50 spindles were analysed for each strain. A summary of all strains that were tested in this assay is listed in supplementary Table 1. (b) Centrosome number was determined by immunostaining HMECs (left panel) and fibroblasts (right panel) with Ab to γ-tubulin; n=50 cells for each line were counted and cells with centrosomes ≤2 were considered normal. A summary of the lines that were tested is presented in Supplementary Table 1. (c) S-phase checkpoint in response to UV- and IR-induced DNA damage in control and BRCA1mut/+ strains. Three BRCA1+/+ (AR7, CP22 and CP29) and three BRCA1mut/+ HMEC strains (79, CP10 and CP16) were irradiated with increasing doses of UV (left panel). For IR-induced S-phase checkpoint analysis (right panel), cells were exposed to IR (10 Gy, red). Non-irradiated cells (0 Gy, blue) served as controls. Error bars indicate the s.d. between the results of three, independent experiments. (d) G2/M checkpoint activation in response to UV- and IR- induced DNA damage in BRCA1mut/+ and control cells. BRCA1+/+ and BRCA1mut/+ cells were irradiated with either UV (10 J m−2) or IR (10 Gy), allowed to recover for 2 h and then harvested for FACS analysis. The percentage of cells in mitosis was determined by staining cells with propidium iodine (PI) and phosphorylated histone H3 (S28) antibody. Mock-irradiated (-Dam) cells served as controls. (e) HMECs and (f) fibroblasts were exposed to IR (10 Gy) and allowed to recover for 4 h. Cells were fixed and co-immunostained with Abs to γ-H2AX and Rad51. Graphs depicting the fraction of cells with Rad51 foci that co-localized with γ-H2AX foci for each line are plotted for both HMECs and fibroblasts (right panels in e and f). Mean and s.d. of at least three experiments for each strain are shown. wt BRCA1+/+ (green) and BRCA1mut/+ (red) lines.

