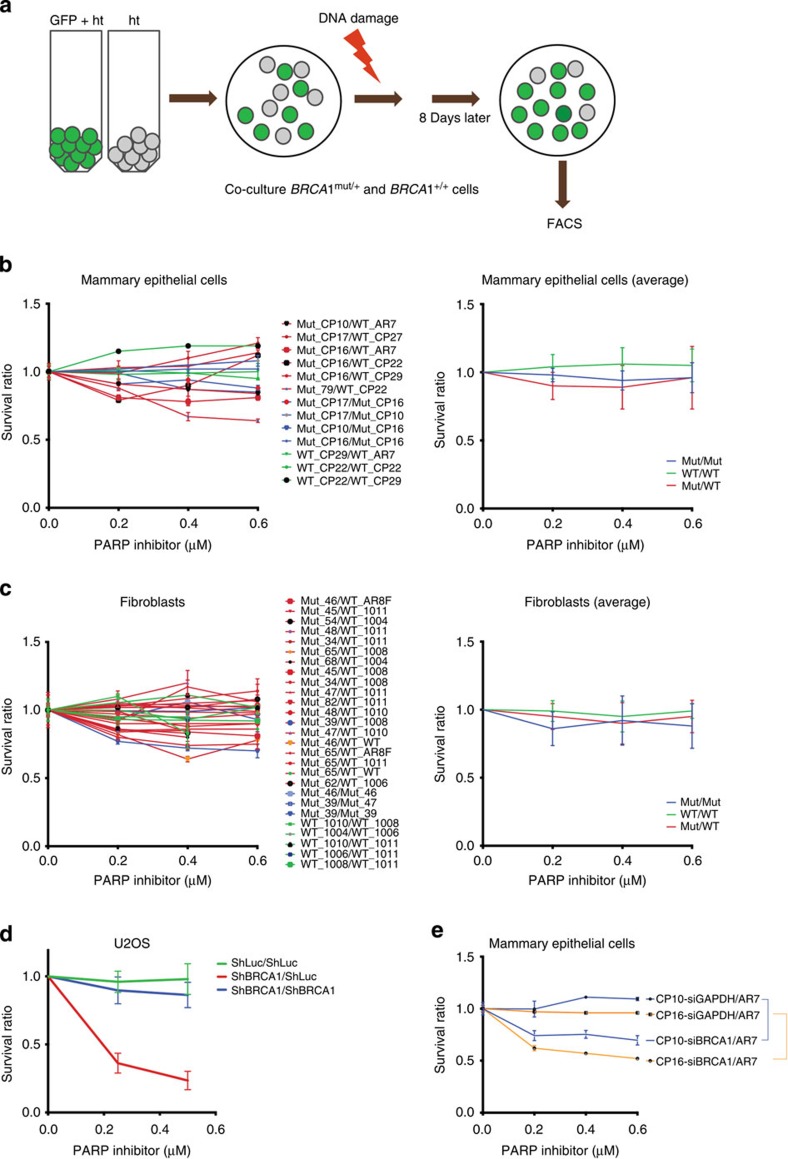
Figure 3. FACS-based cell survival assay shows that HR-DSBR is not defective in BRCA1mut/+ cells.
(a) FACS-based cell survival assay was used to determine the sensitivity of cells to various DNA damage inducing agents. BRCA1mut/+ and BRCA1+/+ ‘colour-coded’ cells were co-plated and exposed to DNA damaging agents. Cell survival data are plotted as a ratio of GFP positive to GFP negative cells. Ratio between WT/WT(Green), Mutant/Mutant (Blue) and Mutant/WT (Red) is plotted in the graphs below. (b) Combinations of BRCA1mut/+ and BRCA1+/+ HMECs were exposed to different concentrations of a PARP inhibitor, and the ratio of each of these combinations was plotted (left). The average ratio of WT/WT, Mut/Mut and Mut/WT was also calculated and plotted (right). (c) (Left) Combinations of BRCA1mut/+ and BRCA1+/+ fibroblasts were exposed to different concentrations of a PARP inhibitor, and the survival ratio of each of these combinations was plotted (left). An average ratio of WT/WT, Mut/Mut and Mut/WT was also calculated and plotted (right). (d) U20S cells (containing or lacking a GFP reporter) were infected with ShLuc (control) or ShBRCA1 coding lentiviral vectors. Green=ratio of number of ShLuc-treated cells to ShLuc-treated cells, that is (ShLuc/ShLuc), Blue=ratio of number of ShBRCA1-treated cells to ShBRCA1 treated-cells, that is, ShBRCA1/ShBRCA1 and Red=ratio of number of ShBRCA1-treated cells to ShLuc-treated cells, that is, ShBRCA1/ShLuc. Averages of the results of individual experiments are plotted. (e) BRCA1mut/+ (CP10 and CP16) were transduced with shRNA directed at GAPDH (siGAPDH) or BRCA1 (siBRCA1). Three days post transfection, combinations of siGAPDH or siBRCA1-transduced BRCA1mut/+ HMECs (CP10 and CP16) were co-plated with AR7 (a BRCA1+/+ HMEC) and exposed to various doses of a PARP inhibitor. Averages of the results generated by these combinations were plotted. Error bars were calculated as the standard error propagation (SEP) in the ratios of each of the combinations in three independent experiments.

