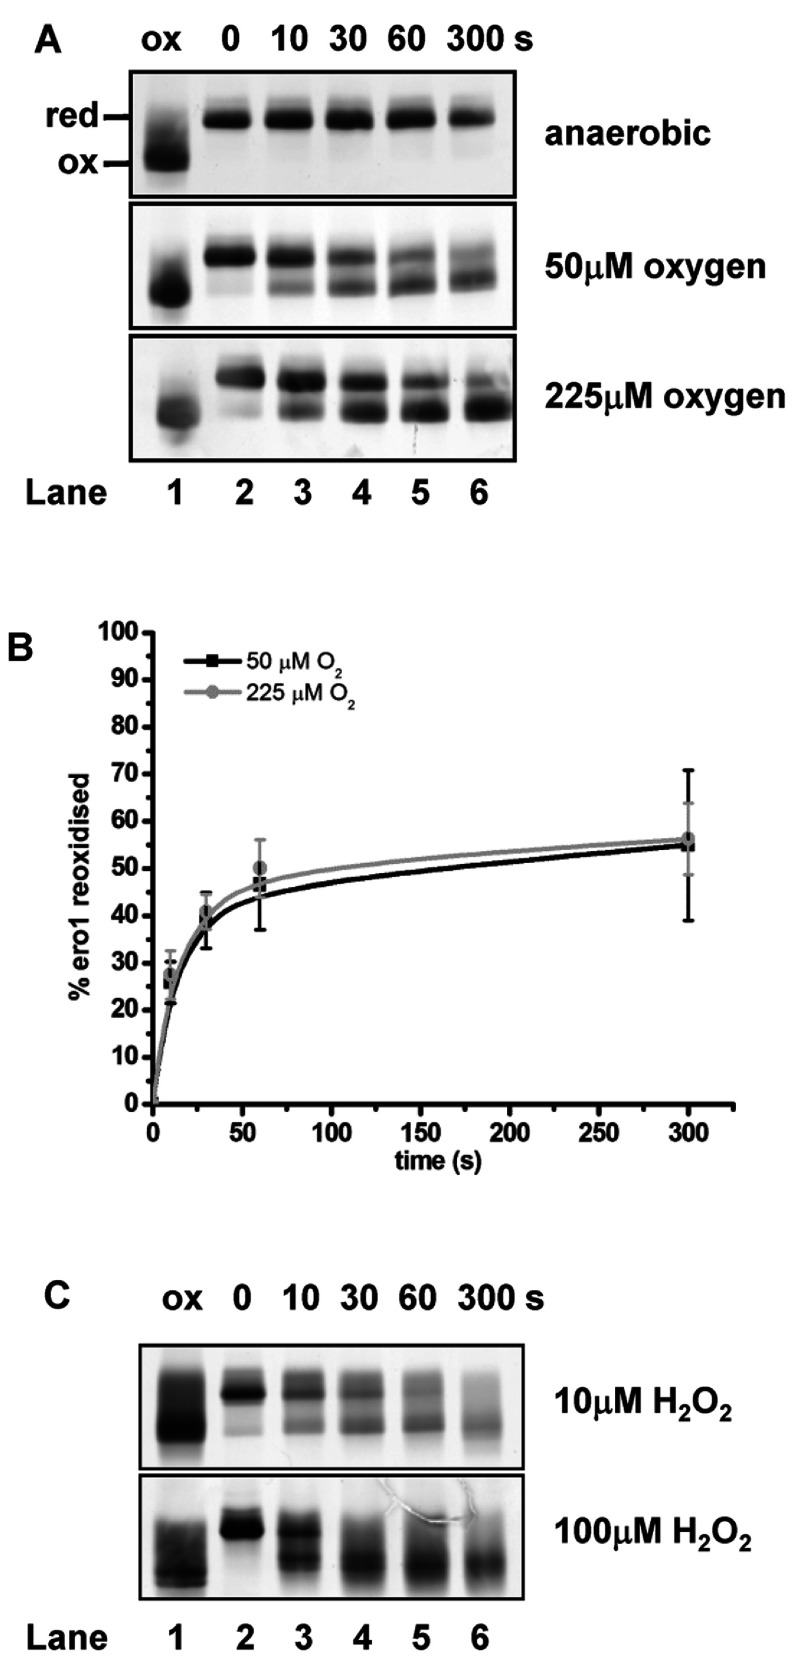
Figure 2. Autonomous oxidation of Ero1α by oxygen and H2O2.
Reduced Ero1α (2 μM) was incubated either under anaerobic conditions or with increasing concentrations of oxygenated buffer (A) or H2O2 (C). The redox state of Ero1α was frozen by alkylating with NEM at the given time points (annotated in seconds), before analysing the samples by non-reducing SDS/PAGE and silver staining. The positions of the fully reduced (red) and oxidized (ox) forms are as indicated. (B) The fraction of Ero1α re-oxidized in the presence of oxygen for three independent experiments was quantified and the mean value calculated and plotted against the time of incubation (error bars represent S.D.).

