
Figure 3.
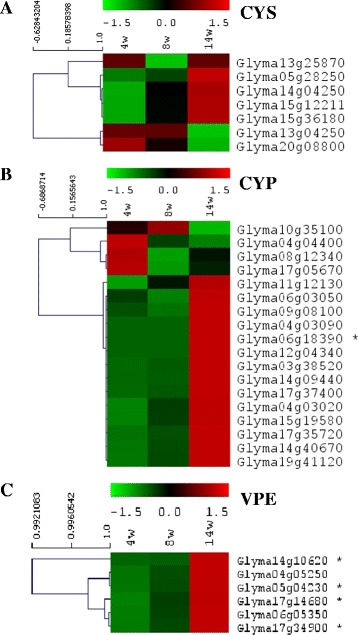
Expression changes of cystatins, cysteine proteases and vacuolar processing enzymes. (A) Expression of cystatins (CYS) (B) cysteine proteases (CYP) and (C) vacuolar processing enzymes (VPE) in 4, 8 and 14 week old nodules expressed as FPKM (transcript abundances in fragments per kilobase of exon per million fragments mapped). Colour scale represents transcription for each time point normalized by subtracting the mean/median of three values from each individual value for each gene reduced by SD/RMS. * indicates significant change (p < 0.05) in transcription between individual time points. Multi-experiment viewer (MeV v4.8.1) software package was applied to graphically represent data [52].