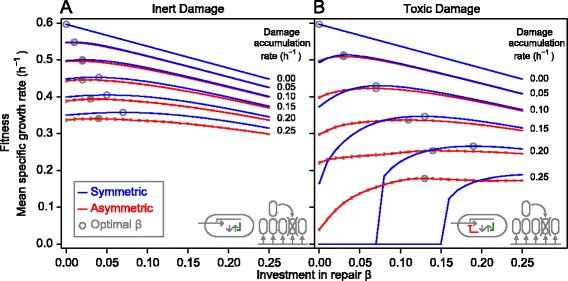
Figure 3.

Existence of optimal investment in repair for both symmetric and asymmetric damage segregation strategies. The dependence of the mean specific growth rate on the level of investment in repair β is shown for completely asymmetric (red) and completely symmetric (blue) segregation strategies over a range of damage accumulation rates. Optimal investment in repair β is indicated by circles. The optimum was at a higher β for symmetric division. Fitness at the optimal β for symmetric division was higher than the fitness at the optimal β for asymmetric division. Repair was more beneficial if damage was not segregated. Damage is assumed to be (A) inert or (B) toxic. The environment is constant. Error bars show standard deviations (n = 400).
