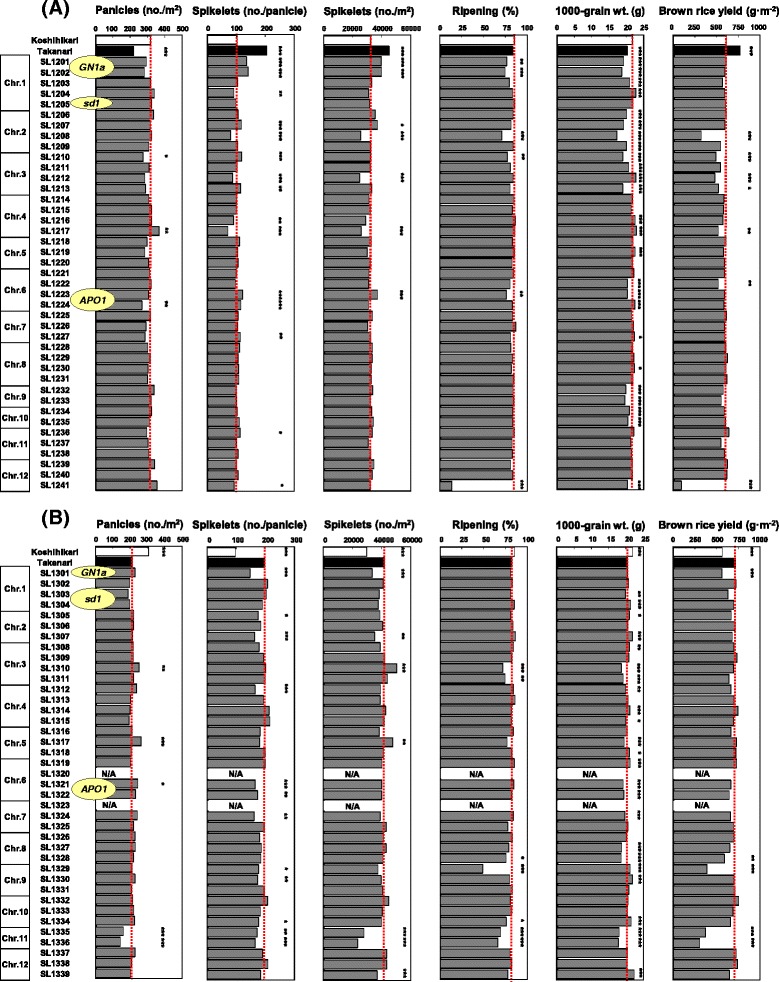
Figure 5.

Yield and its components for the chromosome segment substitution lines (CSSLs) in the Koshihikari (A) and Takanari (B) backgrounds. Bars indicate mean values over two years. Dashed red lines denote trait values in Koshihikari (A) and Takanari (B). ***P <0.001, **P <0.01 and *P <0.05 versus Koshihikari (A) and Takanari (B), assessed by Dunnett’s test. N/A, not available. GN1a, sd1, and APO1 adjacent to the name of a CSSL indicate that the CSSL carries that gene.
