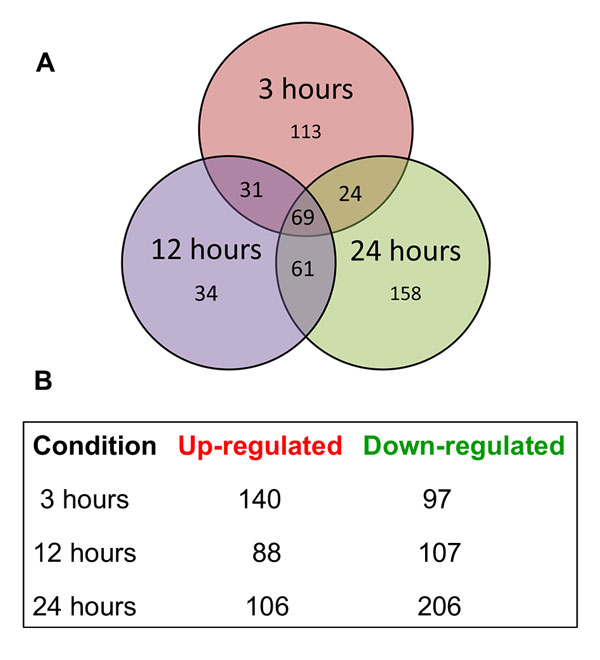
Figure 1.

Acriflavine-induced differential gene expression. (A) Venn diagram illustrates the time-dependent differential expression of 490 genes of Trichophyton rubrum, after exposure to acriflavine for 3, 12, and 24 h, compared to the control (0 h). (B) Illustration of the number of up- or down-regulated genes in each experimental condition.
