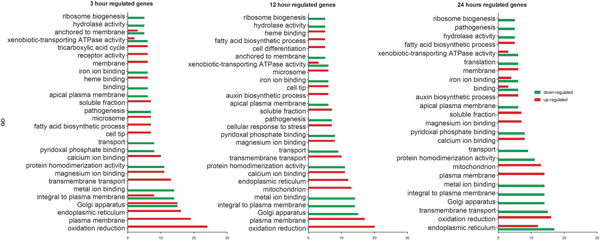
Figure 2.

Gene ontology-based functional categorization of the differentially expressed genes. The significantly enriched (p < 0.05) GO categories are represented, with the red and green bars indicating the number of up- and down-regulated genes, respectively.
