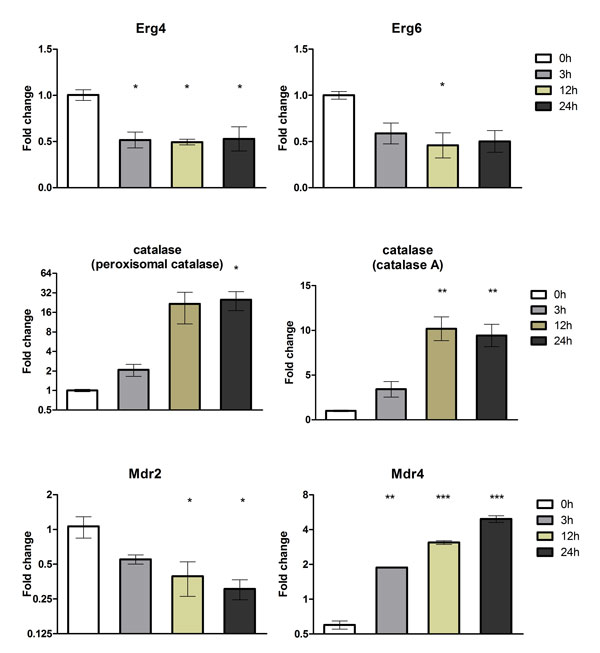
Figure 5.

Validation of differentially expressed genes using quantitative real-time PCR (qRT-PCR). Six genes that were modulated in response to acriflavine were amplified using the cDNA obtained from the mycelia of T. rubrum exposed to acriflavine for 3, 12, and 24 h. The gene expression levels are represented by the fold changes at each time point relative to the control (0 h). The genes are listed in Table 3. The results of the qRT-PCR assay, from two independent experiments, are expressed as mean ± standard deviation (S.D). Statistical significance was determined using Bonferroni's ad hoc test and indicated by asterisks: * indicates p < 0.05; ** indicates p < 0.01; *** indicates p < 0.001.
