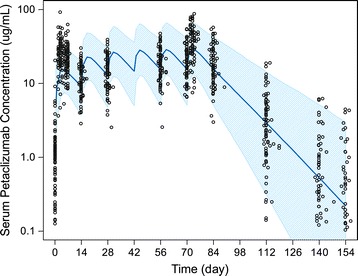
Figure 1.

Observed versus population PK model predicted pateclizumab serum concentration-time profiles. Dose was given on study days 0, 14, 24, 42, 56, and 70. The empty symbols represent the observed individual serum concentrations at planned sampling times. The solid line represents the population PK model (built based on phase I PK data) predicted median serum concentration-time profile. The shaded band represents model predicted 90% confidence interval of the concentration-time profile for the study population. PK, pharmacokinetic.
