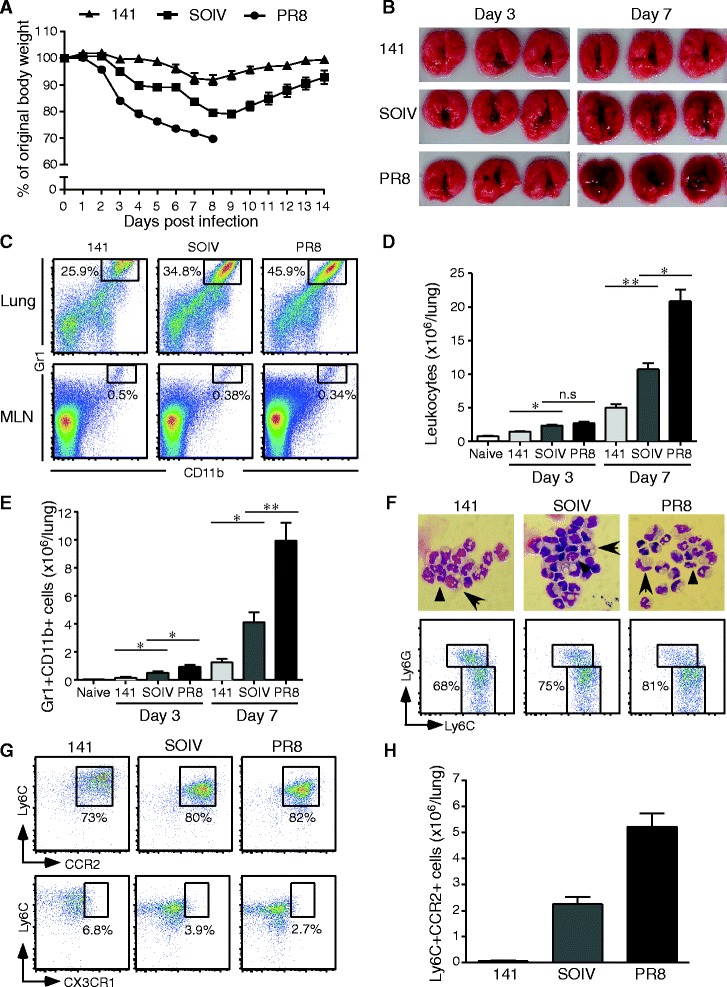
Figure 1.

Excessive accumulation of CCR2+ inflammatory monocytes in severe IAV infection. C57BL/6 mice were infected with 200 PFU of 141, SOIV or PR8 viruses. (A) Body weights were monitored daily until day 14 post-infection (n = 6 -8 per group, mean ± SEM). (B) Appearance of lung inflammation was photographed at days 3 and 7 post-infection (n = 3 per group). (C) Total leukocytes were stained with Abs against Gr1 and CD11b. The percentage of Gr1 + CD11b + myeloid cells was analyzed by flow cytometry. (D) Total leukocytes were harvested from the lungs at the time points indicated and counted by trypan blue exclusion. These data are a composite of four to seven independent experiments (n = 3 per group, mean ± SEM; n.s: no significant difference; *P < 0.05; **P < 0.01). (E) Numbers of Gr1 + CD11b + myeloid cell of lung were shown. These data are a composite of four independent experiments (n = 3 per group, mean ± SEM; ns: no significant difference; *P < 0.05; ** P < 0.01). (F, upper panel) Gr1 + CD11b + cells were sorted from infiltrating leukocytes and then stained by Wright stain. The cell morphology was photographed under 1000× magnification using an Olympus microscope. Granulocytes are indicated by arrow heads and monocytes are indicated by arrows. (F, lower panel). The percentage of Ly6G-Ly6Chigh monocytes in the Gr1 + CD11b + gated population is shown. Dot plots are the representative result from three repeated experiments with three mice per group. (G) The percentage of CCR2+ inflammatory monocytes and CX3CR1 patrolling monocytes in Gr1 + CD11b + myeloid cells. (H) Numbers of Ly6ChighCCR2+ inflammatory monocytes were shown at day 7 post-infection. This is a representative result from four repeated experiments with three mice per group.
