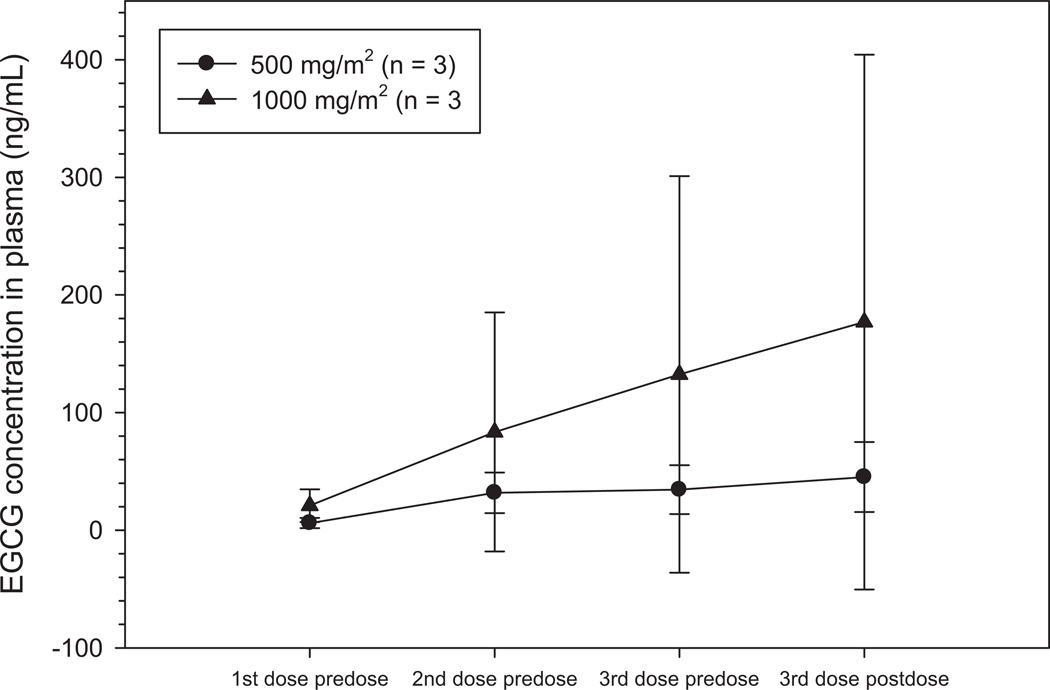
Figure 3.
A trend toward a dose-dependent increase in plasma EGCG concentrations during TID administration of green tea extract (GTE). Each symbol represents arithmetic mean concentrations ± SD. The data shows some dose-dependent accumulation of EGCG over the sampling period of approximately 9–12 hours although variability in plasma concentrations at 1000 mg/m2 is very high. Trough concentrations following the last dose from the previous day are similar for both arms and no significant accumulation of drug is observed.

