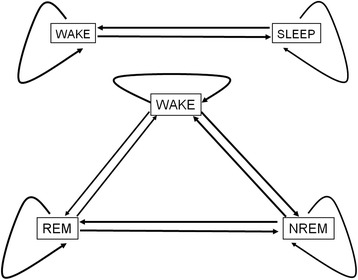
Figure 2.

Markov chain representations of sleep stages and transitions between them. The system might jump to a new state or might remain in the current one at any time point. Straight lines represent the transition rates from and back between two stages and curved lines show staying in the current stage. The average time spent between two jumps in a given stage is the sojourn time of the stage. Four parameters (two transition rates and two sojourn times) are needed to describe a Markov model with two states (upper panel) while fitting a Markov model with three states (lower panel) requires the determination of nine parameters (six transition rates and three sojourn times).
