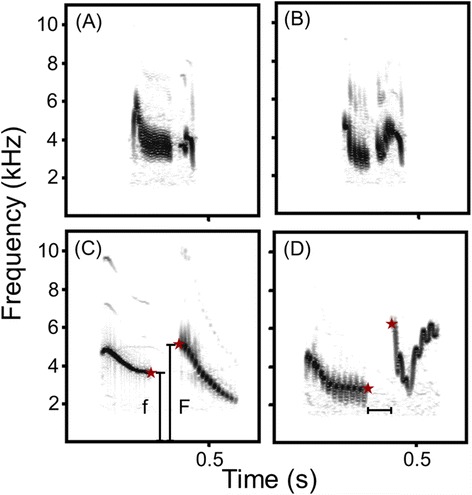
Figure 1.

Spectrograms of subsequent syllables produced by a male skylark in response to a territorial playback. (A,B) Examples with small gaps. (C,D) Examples with large gaps. Red stars indicate peak frequency of the end of the first syllable and the start of the subsequent syllable. Inter-syllable frequency ratio was calculated by dividing the larger peak frequency (vertical bar ‘F’) by the smaller one (vertical bar ‘f’). The horizontal bar indicates gap duration.
