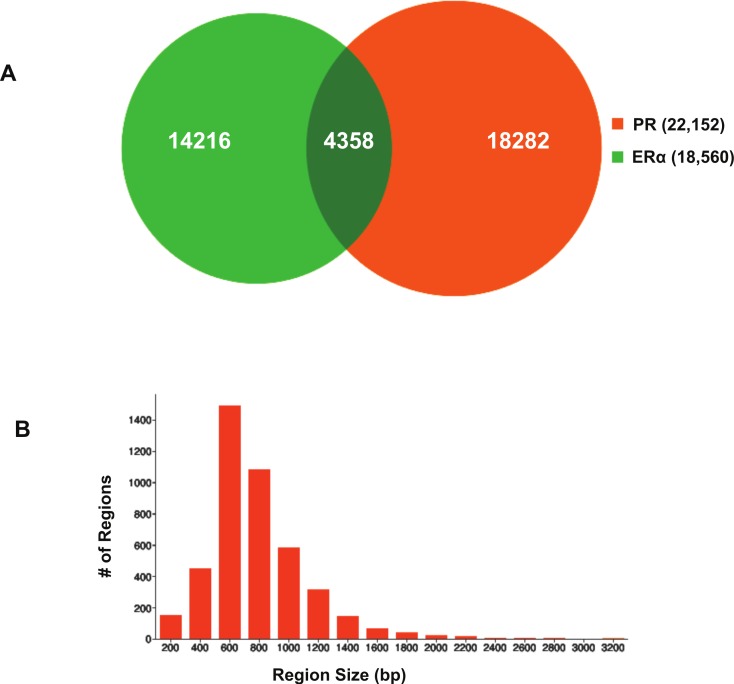
Figure 3. Visualisation of ERα and PR binding region overlap.
(A) Venn diagram showing overlap between ERα and PR data. The 4,344 ERα binding regions overlap with 3,870 unique PR binding regions making up 4,358 overlapping sections. (B) Region sizes of 4,358 regions common to the ERα and PR datasets.

