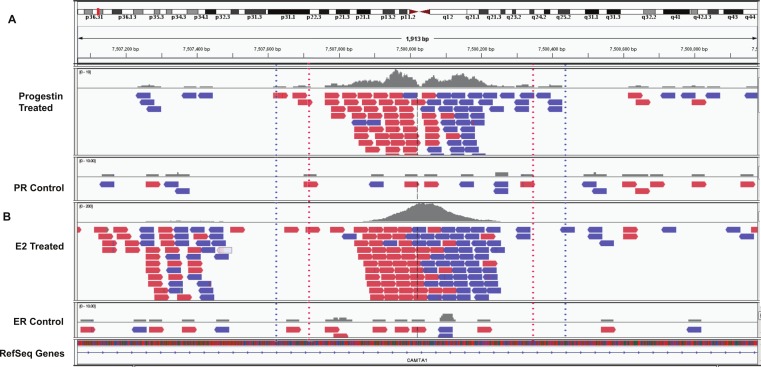
Figure 4. Example overlapping region.
IGV snapshot of PR binding region at chr1:7507615–7508428 (marked by blue dotted lines) and ERα binding region (marked by red dotted lines). (A) Progestin treated and control samples. (B) Estradiol (E2) treated and control sample. The red boxes are reads that mapped to the forward strand and blue boxes are reads that mapped to the reverse strand of the human genome (build hg19).

