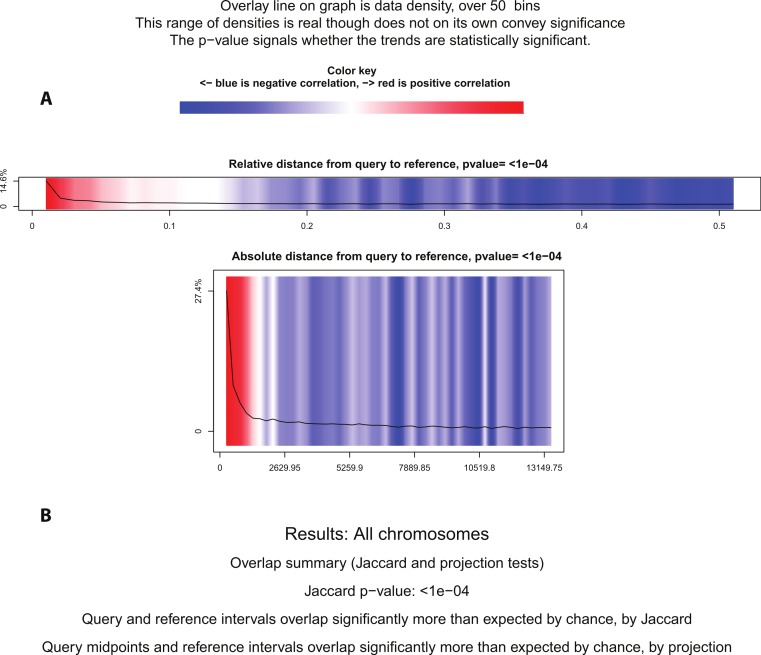
Figure 5. Statistical significance test using Genometricorr.
Genometricorr statistical significance analysis of ERα (query)-PR (reference). (A) Relative and Absolute Distance Correlation tests are shown graphically. Overlay line (data density) when in the blue section shows negative correlation while the high density in the red section shows positive correlation. (B) Results from Jaccard and Projection tests are shown in text.

