Figure 1.
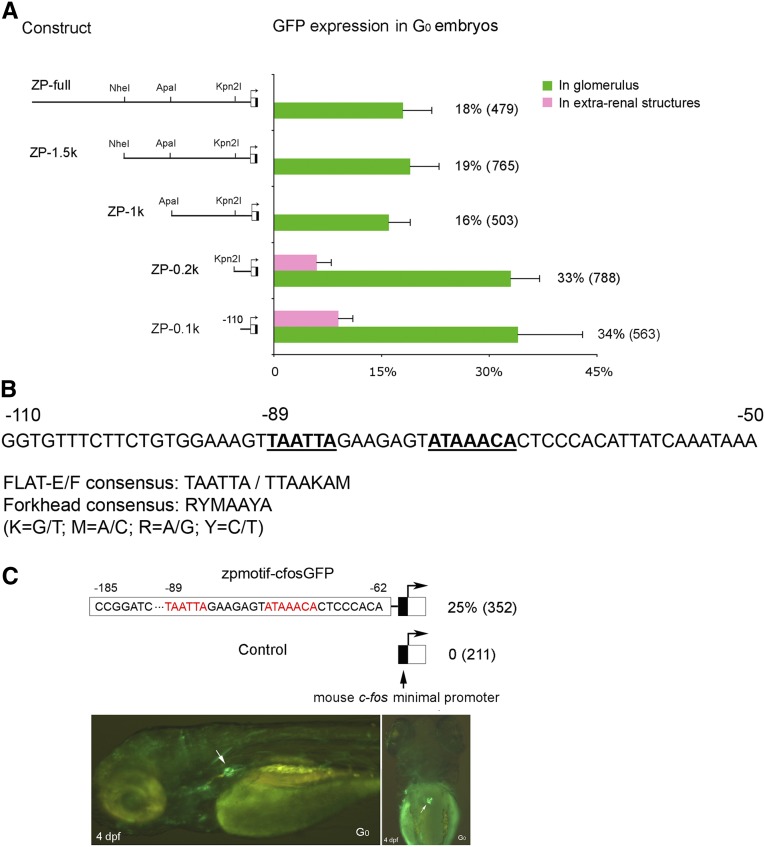
Identification of a 49-bp enhancer sufficient to direct GFP expression in zebrafish podocytes. (A) Fine-mapping of the zebrafish nphs2 promoter fragment by deletion analysis. The constructs carrying different sizes of inserts are schematically shown in left panel. GFP expression rate, defined as percentage of positive G0 embryos expressing GFP in glomeruli or extrarenal structures out of total embryos, is illustrated with bar graphs. Total number of G0 embryos is indicated in parentheses. SD in the bar graph shows a variation in three independent injections. (B) DNA sequence analysis. The zebrafish nphs2 promoter element from −110 to −50 bp is shown. Consensus of the FLAT-E or -F element and the forkhead-binding site are denoted.21,25 The putative DNA-binding sites in the sequence are marked in bold and underline. (C) Heterologous promoter analysis. The zebrafish promoter element with two putative binding sites marked in red between −185 and −62 bp was subcloned in the Tol2-cfos-GFP plasmid (zpmotif-cfos-GFP) and is schematically illustrated. The mouse c-fos minimal promoter (arrow) in the plasmid is indicated. The empty plasmid was used as a control. GFP expression rate described above is shown. Microscopic imaging laterally and dorsally shows GFP expression in G0 glomerulus (arrow). GFP is also visible in other tissues.

