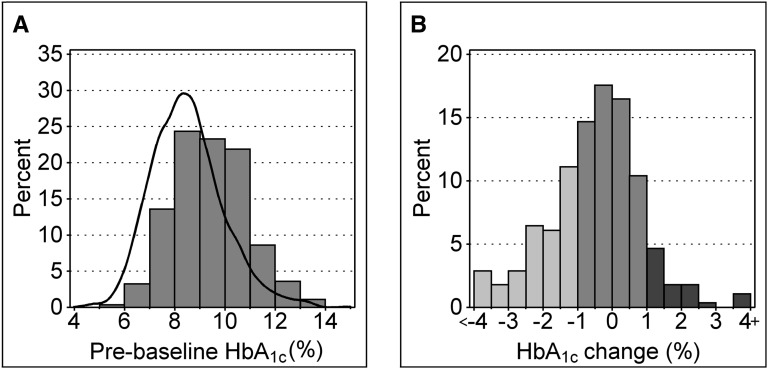
Figure 2.
Pre- and postbaseline HbA1c in the complete cohort. (A) Distribution of prebaseline HbA1c in 279 patients with CKD stages 1–3 from the Joslin Proteinuria Cohort. The black contour outlines distribution of HbA1c (5-year average) in 1412 patients from the Joslin Clinic without proteinuria. (B) Distribution of changes between pre- and postbaseline HbA1c (postbaseline level measured over median of 5.1 years). Improvements >1 percentage point are light gray, deteriorations >1 percentage point are dark gray, and changes within a 1% boundary are depicted in intermediate shade.

