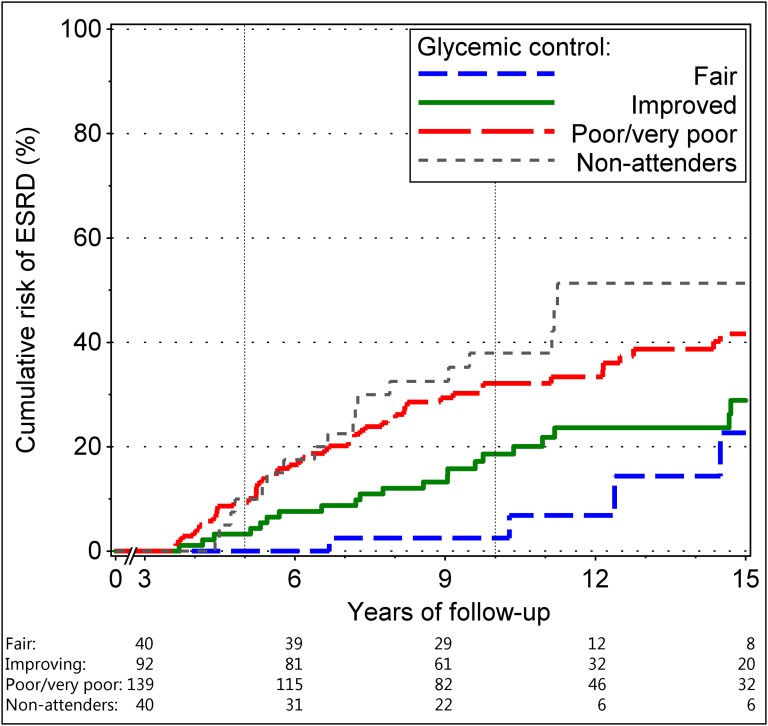
Figure 3.
Cumulative risk of ESRD according to pre- and postbaseline HbA1c. Risk in 40 patients with fair (≤8%) pre- and postbaseline HbA1c is represented by blue dotted line, risk in 92 patients in whom poor or very poor prebaseline HbA1c improved is shown as green solid line, and risk in 139 patients with poor (>8% to ≤9.5%) and very poor (>9.5%) pre- or postbaseline HbA1c is shown as red interrupted line. The risk in 40 nonattenders is represented by gray dotted line. Number of patients remaining in the risk set is shown at the bottom.

