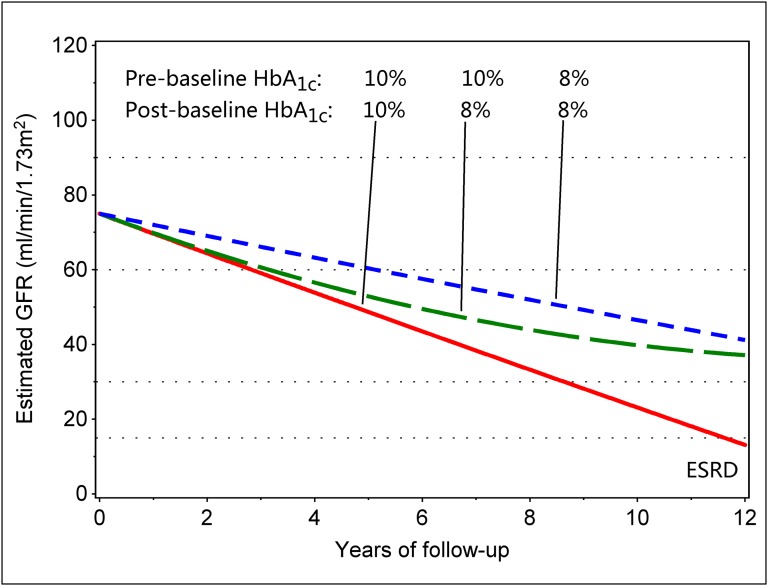
Figure 4.
Sample trajectories of renal function decline according to pre- and postbaseline HbA1c. The trajectories were predicted with quadratic joint longitudinal-survival model in patients with different pre- and postbaseline HbA1c: straight lines were estimated in cases where HbA1c remained unchanged. The line curved upward illustrates sustained improvement of HbA1c by 2 percentage points (from 10% to 8%).

