Figure 3.
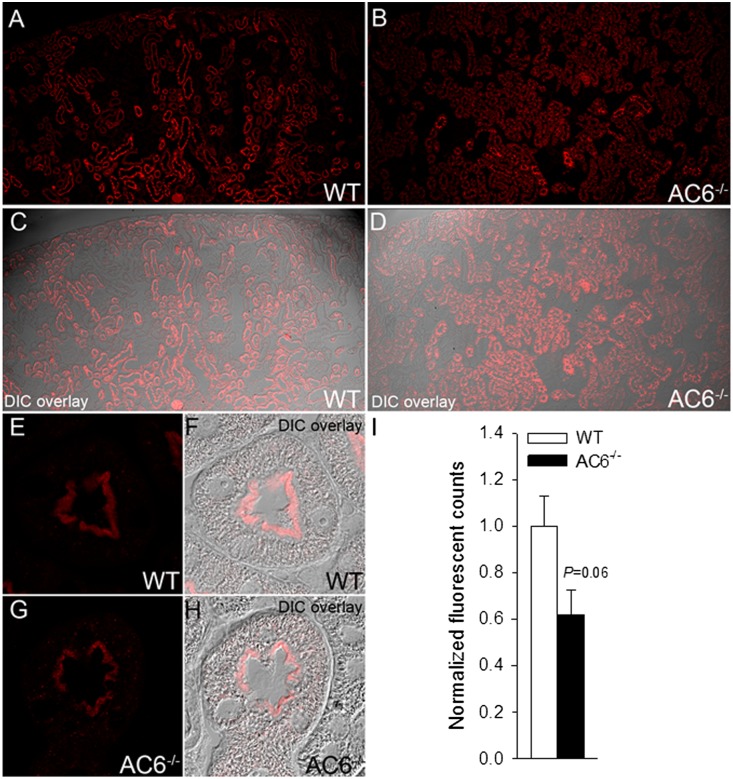
Quantitative immunofluorescent labeling identifies reduced Npt2a in AC6−/− mice. Immunofluorescent labeling of Npt2a and quantitative confocal laser-scanning microscopy. A and B show representative images of cortical kidney sections from WT and AC6−/− mice under control conditions. (C and D) Differential interference contrast (DIC) overlay to show kidney structure and localization of imaging. (E and F) At high magnification, Npt2a staining in WT mice was predominantly localized to the apical microvilli. (G and H) In AC6−/− mice, Npt2a staining was weaker compared with WT mice and observed in the apical microvilli and intracellular in a punctate distribution. (I) Quantification of Npt2a labeling intensity (mean fluorescent signal) shows that total Npt2a labeling intensity is reduced in AC6−/− mice compared with WT (n=4/genotype).

