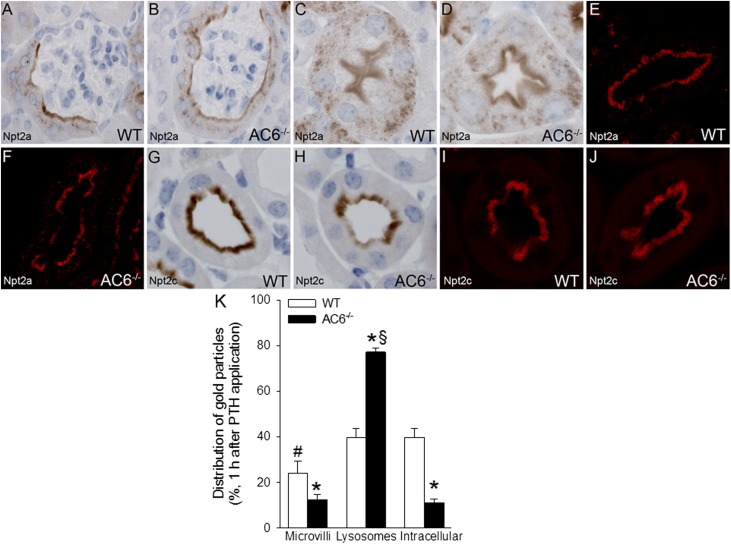
Figure 9.
PTH treatment results in comparable immunolocalization of Npt2a and Npt2c in WT and AC6−/− mice. (A and B) After PTH treatment (200 µg/kg), immunohistochemistry shows that Npt2a labeling and distribution were similar between WT and AC6−/− mice in the early (S1) segment of the proximal tubule, with staining observed in the apical microvilli and intracellularly. (C and D) No observable difference in Npt2a labeling or distribution between WT and AC6−/− mice in the late (S3) segment of the proximal tubule. (E and F) Quantitative laser-scanning confocal microscopy confirmed the similar distribution of Npt2a in WT and AC6−/− mice after PTH treatment. (G–J) After PTH treatment, the distribution of Npt2c was similar in WT and AC6−/− mice, with predominant labeling of the apical brush border. No differences were observed in Npt2c distribution compared with control conditions (Figure 4). (K) In WT mice, compared with control conditions (Figure 4), the distribution of Npt2a gold particles after PTH treatment was shifted, with fewer particles residing in the apical microvilli compared with lysosomes and intracellular compartments. In contrast, after PTH treatment, the distribution of Npt2a in AC6−/− mice is similar to control conditions (Figure 4) (n=4/genotype). *P<0.05 versus corresponding WT group. #P<0.05 versus lysosomes and intracellular in WT. §P<0.05 versus microvilli and intracellular in AC6−/−.

