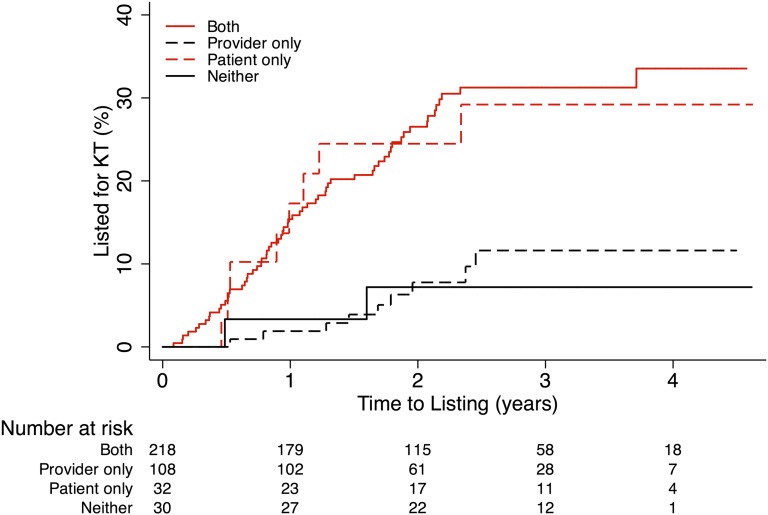
Figure 1.
Listing for KT, by patient and provider report of provision of information. Estimated cumulative incidence of listing for KT by provider or patient report of provision of information. Curves are estimated using the Kaplan–Meier method. The log-rank test for difference by provision of information and the log-rank test for trend across age groups are statistically significant (P<0.001). Entry (time zero) is the date of dialysis initiation. Participants are censored at time of listing for KT, death, or end of study.

