
Figure 4.
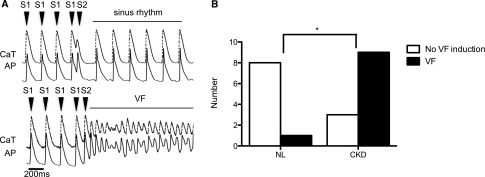
CKD rats are more vulnerable to ventricular fibrillation than NL rats. VF inducibility was evaluated by applying a premature stimulus (S2) after nine consecutive regular stimuli (S1). The CaT is represented by the dashed upper line, and the AP is represented by the solid lower line. (A) Upper panel is a representative tracing showing failure of VF induction, and lower panel is an example of successful induction of VF. (B) The VF inducibility of CKD rats was higher than in NL animals when compared by Fisher exact test (n=9 and n=12 for NL and CKD, respectively). *P<0.05.