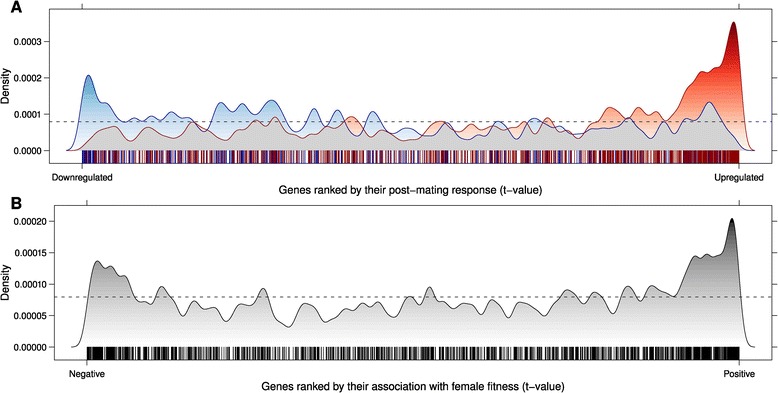
Figure 4.

Association with post-mating response and female fitness . (A) Density distribution of significant up-regulated (blue) and down-regulated (red) transcripts in monogamous (versus promiscuous) females along all the tested genes, ranked according to their post-mating reaction (data from a previously published study on the same population; Innocenti and Morrow [44]). (B) Density distribution of the significant transcripts along all the tested genes, ranked by the t-value of their association with female fitness (data from a previously published study on the same population; Innocenti and Morrow [60]).
