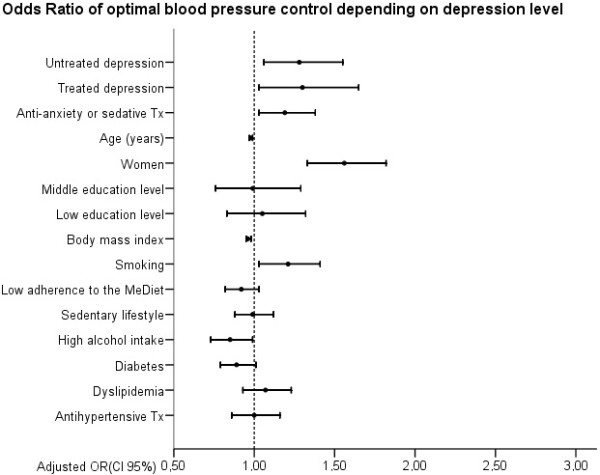
Figure 1.

Odds Ratios of optimal blood pressure control according to depression level. Circles represent Odds Ratios, Horizontal lines indicate 95% confidence intervals and vertical line references OR = 1. Tx indicates treatment and MeDiet indicates the Mediterranean Diet. No depression is the reference category for the response variable.
