Figure 4.
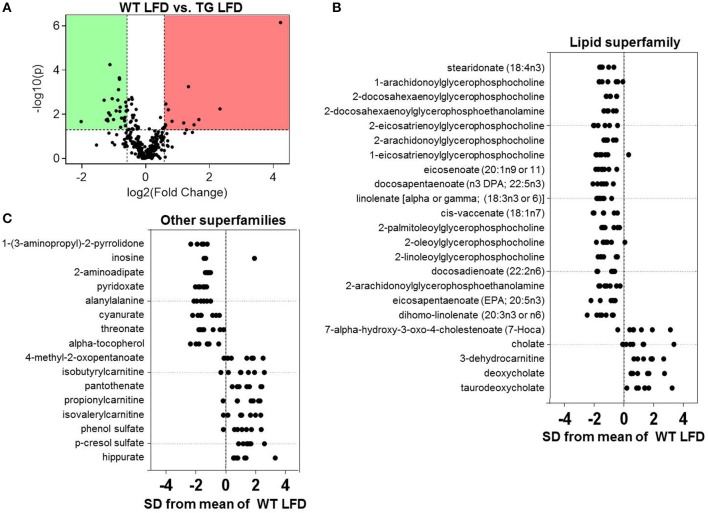
Effects of eNOS overexpression on the plasma metabolite profile. Metabolomic analyses of plasma from wild type (WT) and eNOS-TG mice fed a low fat diet (LFD) for 6 weeks. (A) Volcano plot of metabolites: Those metabolites that increased significantly are in the region of the plot shaded red and those that decreased significantly are in the region shaded green (p < 0.05, unpaired t-test); (B,C) Z-score plot analysis of metabolite changes in plasma from low fat-fed WT and eNOS-TG mice, separated by metabolite superfamily. Data are shown as standard deviations from the mean of WT LFD. Only metabolites that increased or decreased significantly and were changed by ≥50% are shown. Each point represents one metabolite in one sample. n = 14 animals: 7 WT LFD and 7 WT HFD.

