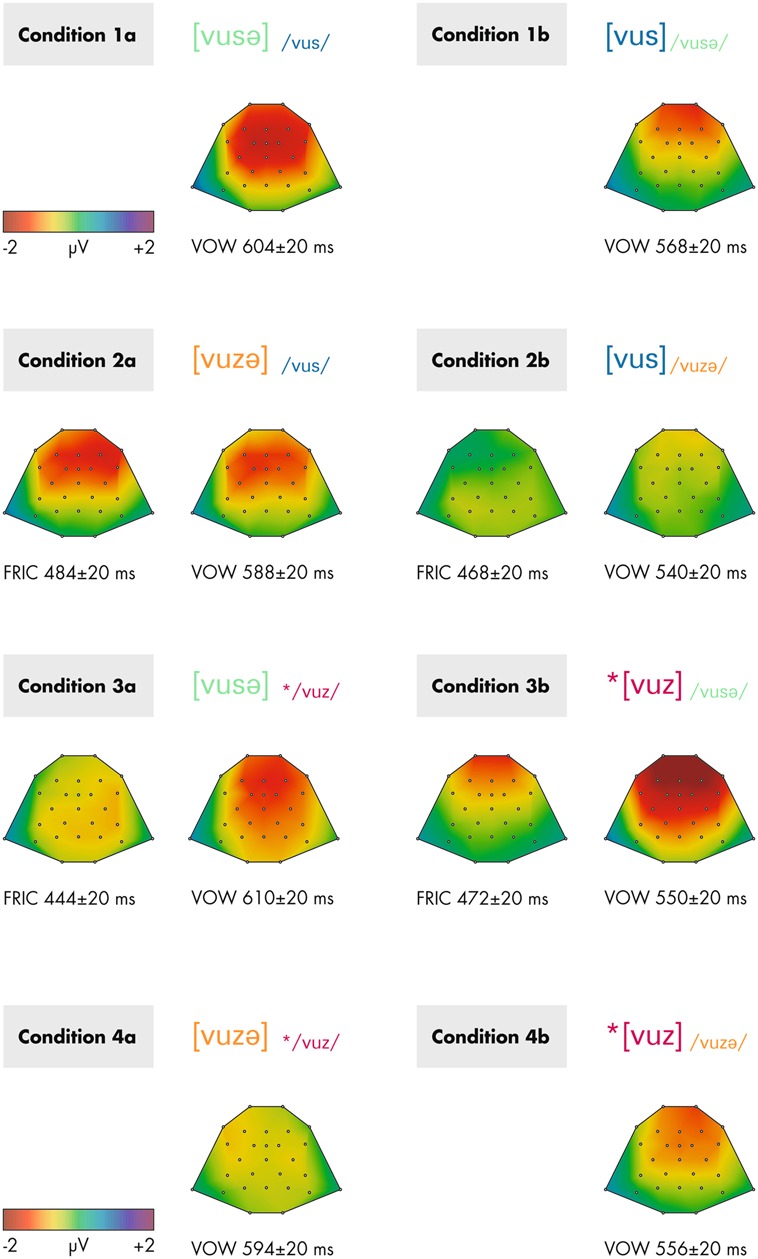
FIGURE 3.

Topographical maps of the analyzed deviance-minus-standard differences obtained from grand-averaged re-referenced data within the time windows stated below each map. Depicted are contrasts 1–4 separately for conditions a (left) and b (right). FRIC indicates that the marked time range is attributed to the voicing change in the second fricative, VOW indicates that the marked time range is attributed to the final vowel. The asterisk * indicates ill-formedness.
