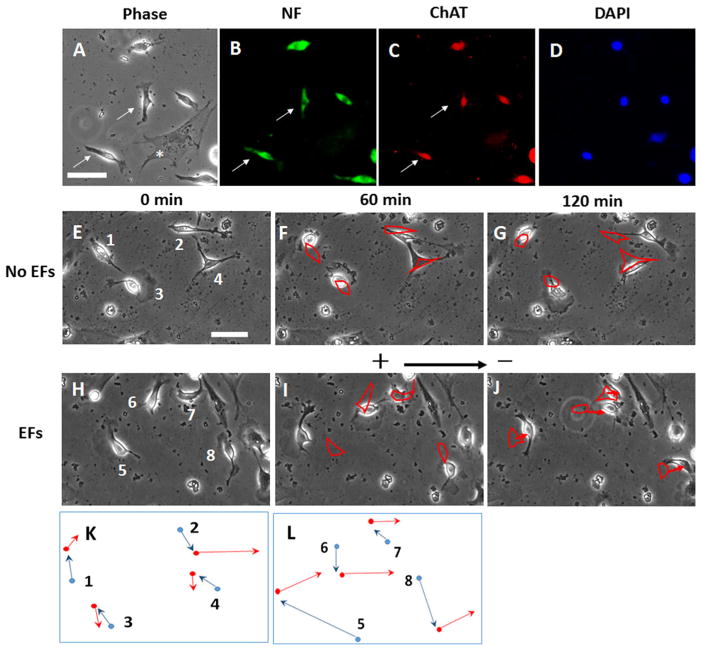
Fig. 4.
Dissociated presumptive motor neurons migrated toward the cathode in a direct current electric field (EF). a–d The same field of choline acetyl transferase staining (ChAT, marker of cholinergic neural cells) are shown. In A, phase contrast image. In B, cells were immuno-cytochemically labelled with neural filament (NF) antibody (green), In C, cells labelled with ChATantibody (red) and, in D, the nuclei were labelled using DAPI. The arrows indicate the ChAT- and NF-positive cells and they show the typical bipolar morphology. Phase dark (flattened) cells indicated by asterisk (*) denotes a mitotically inactivated mouse embryonic fibroblast. Panels E through J show time-lapse images of single neural cells migrating. e–g The random migration of cells during 2-hour period without EFs stimulation. See also Supplementary Material Video 1. h–j ChAT neural cells that migrate in response to an applied EF (100 mV/mm). The cell migrated randomly without EFs stimulation in the first hour. The cells migrated to the cathode (right) with EFs stimulation in the second hour. See also Supplementary Material Video 2. Outlines of the labelled cells in (f) and (g) highlight cell positions in (e) and (f), respectively. Outlines of the labelled cells in (i) and (j) highlight cell positions in (h) and (i), respectively. The arrows showed the directional migration of the cells in EFs. Scale bar: 50 μm. Figure 4k and l are schematics showing the relative cell translocation and migration direction demonstrated in figure (e–g) and (h–j), respectively. The blue lines indicate the cell migration in the first hour and the red lines indicate the cell migration in the second hour. Dot: cell center; arrow: cell migration direction

