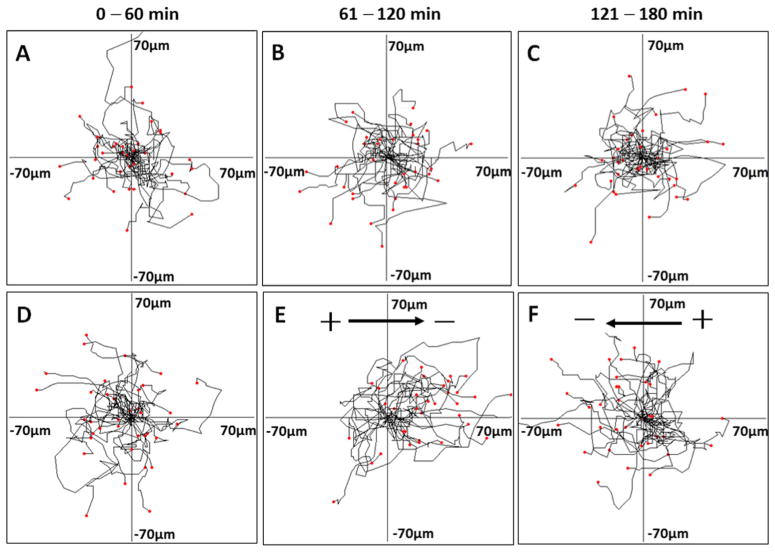
Fig. 5.
The net translocation of embryonic stem cells (ESC)-derived neural cells during 3-hour migration period. Migration paths were determined by video monitor tracings. The position of all cells at t=0 min is represented by the origin position (the center of the frame) with the migratory track of each cell at 60 min plotted as a single line on the graph. Each arm of the axes represents 70 μm of translocation distance. a–c Random cell migration without EFs stimulation during the 3-hour recording period. d–f Presumptive motor neurons migration in an applied EF (100 mV/mm). d The cells migrated apparently randomly without EFs stimulation in the first hour. e Most cells migrated to the cathode with EFs stimulation in the second hour. See also Supplementary Material Video 3. f The cells migrated to the opposite direction after the EFs polarity was reversed in the third hour. See also Supplementary Material Video 4

