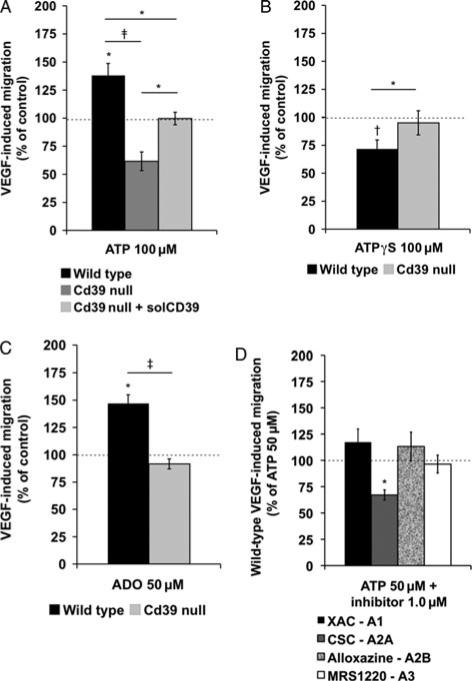
FIGURE 3.
Chemotaxis of murine HSC. A, Migration rates of wild-type and Cd39-null HSCs (3 × 10⁵ bone marrow mononu-clear cells) to vascular endothelial×growth factor (50 ng/mL) 4 hours after preincubation with adenosine triphosphate (100 μM) or adenosine triphosphate (100 μM) + soluble CD39 (solCD39) (5 U/mL; n = 5–6). B, Migration rates of wild-type and Cd39-null HSC toward vascular endothelial growth factor (50 ng/mL) after preincubation with ATPγS (100 μM; n = 6). C, Migration rates of wild-type and Cd39-null HSCs to vascular endothelial growth factor (50 ng/mL) after preincubation with adenosine (50 μM; n = 6). D, Migration rates of wild-type HSCs to vascular endothelial growth factor (50 ng/mL) after preincubation with adenosine triphosphate (50μM) and selective adenosine receptor inhibitors [XAC-A1; CSC-A2A; alloxazine-A2B; or MRS1220-A3: (each 1.0 μM)] (n = 5–6). Error bars represent standard error of mean. †P < 0.01, ‡P < 0.001. 100% equals a mean cell number of n = ~ 1700.

