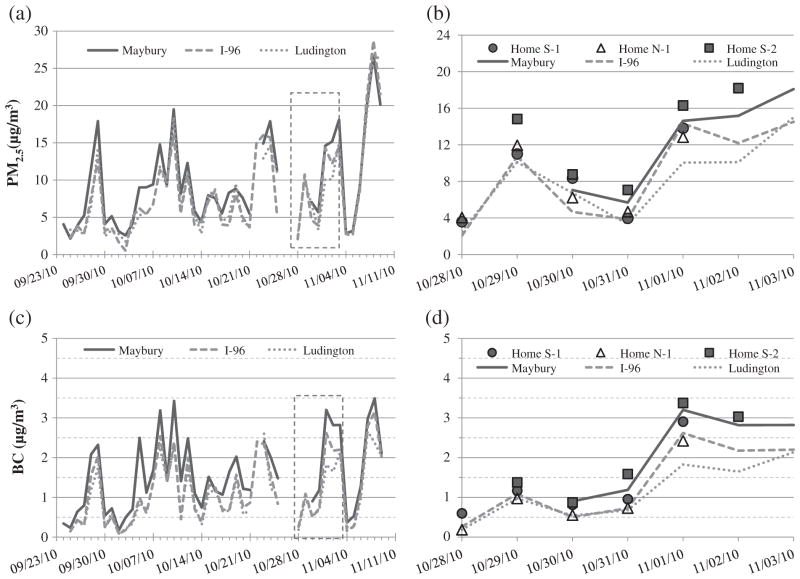
Fig. 3.
Daily integrated (24 h) PM2.5 concentrations (μg/m3) during the Fall 2010: (a) PM2.5 mass with week 6 data highlighted in dashed box, (b) PM2.5 mass for week 6 with data from two HD homes (S-1 and S-2) and one LT home (N-1), (c) PM2.5 black carbon (BC) with week 6 data highlighted in dashed box, and (d) PM2.5 BC for week 6 with data from homes S-1, S-2 and N-1.

