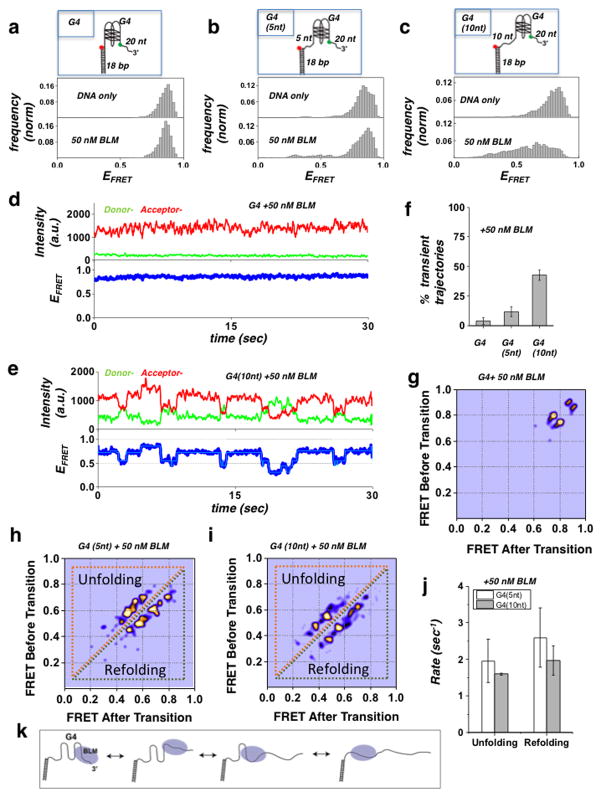
Figure 1. Substrate specific interaction of BLM with G4-forming human telomeric sequence.
(a–c) BLM mediated unfolding of G4 substrates. The illustration of each G4 DNA substrate is shown above their histograms: (a) G4 substrate, with G4 motif immediately adjacent to duplex region. No change in FRET distribution was observed following addition of 50 nM of BLM. (b) G4 (5nt) substrate with a 5 nt ssDNA between the G4 motif and duplex region. Some change is evident upon addition of 50 nM BLM. (c) G4 (10nt) substrate with a 10 nt ssDNA between the G4 motif and duplex region. A substantial change in the FRET distribution was detected upon addition of 50 nM BLM. Histograms were generated after subtracting the zero FRET values and truncating the photo bleached part from FRET trajectory. A minimum of 100 smFRET trajectories was used to generate the histograms. The concentration of K+ was kept at 50 mM
(d) A representative single molecule trajectory of the G4 substrate in the presence of 50 nM BLM showing persistent high FRET. Top panel: donor (green) - acceptor (red) intensities, bottom panel: corresponding FRET trajectory.
(e) Representative smFRET trajectory of the G4 (10nt) substrate in the presence of 50 nM BLM showing dynamic fluctuations in FRET signal (blue). HMM fit is in Cyan.
(f) Quantification of observed transient trajectories in population percentage for each G4 substrate in the presence of 50 nM BLM. (Error bars = S.E.M. n=5).
(g–i) Generated TDP matrix for each G4 substrate in the presence of 50 nM BLM, where the color intensity corresponds to transition probability. The y-axis is the initial FRET prior to transition, and the x-axis is the final FRET after transition. (g) TDP for the G4 substrate with 50 nM BLM showing only the parallel and antiparallel folded conformations of G4. (h/i) TDP for the G4 (5 nt) and G4 (10 nt) substrates (respectively), showing peaks corresponding to unfolding (above diagonal) and refolding (below diagonal) transitions of the G4 motif.
(j) The calculated mean unfolding and refolding rates for the G4 (5 nt) and G4 (10 nt) substrates. (Error bars = S.E.M. n > 20 for all measurements).
(k) Illustration of the BLM-mediated sequential unfolding-refolding transitions of the G4 substrate.

