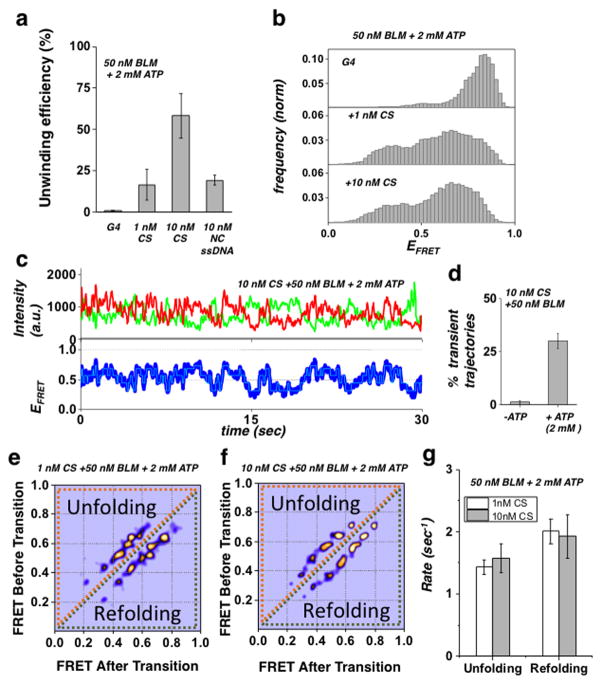
Figure 5. G4 complementary strand-assisted unwinding of the G4 substrate.
(a) Quantification of BLM unwinding efficiency at 50 nM BLM and 2 mM ATP for the G4 substrate in the presence of no CS, 1 nM CS or 10 nM CS, or 10 nM NC ssDNA (Error bar = S.E.M. n=5)
(b) FRET histograms of the G4 substrate in the presence of 50 nM BLM and 2 mM ATP with either no CS (top panel), 1 nM CS (mid panel) or 10 nM CS (bottom panel).
(c) Representative single molecule trajectories of the G4 substrate in the presence of 50 nM BLM, 2 mM ATP and 10 nM CS. FRET trajectories were fitted with HMM (Cyan).
(d) Quantification of population percentage of transient trajectories for the G4 substrate in the presence of 50 nM of BLM and 10 nM CS and with our without 2mM ATP. (Error bar = S.E.M. n=4)
(e/f) Generated TDP matrix of the G4 substrate in the presence of 50 nM BLM and 2 mM ATP as well as either 1 nM CS or 10 nM CS (panels d and e, respectively).
(g) The calculated mean unfolding and refolding rates for the G4 substrate in the presence of 50 nM BLM, 2 mM ATP and at 1 nM or 10 nM CS concentration. (Error bars = S.E.M. n > 34 for all measurements).

