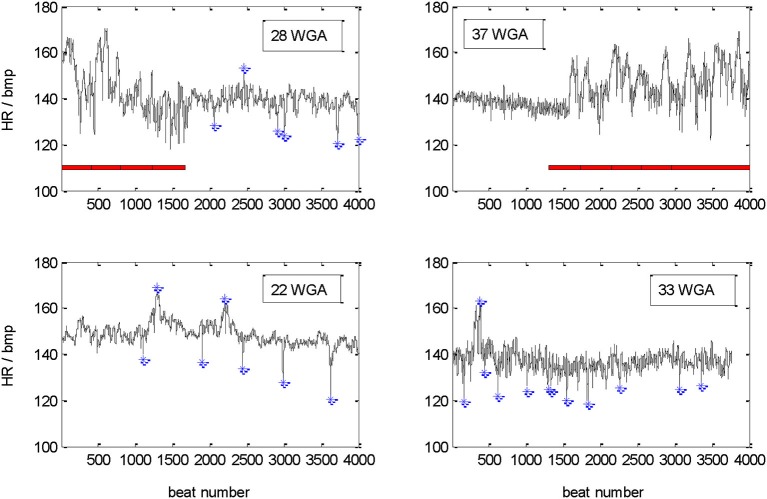
Figure 1.
Tachograms of 30 min recordings of four different fetuses. Upper part: changes between sections of active (marked by red horizontal bar) and quiet sleep related heart rate patterns in a younger (28 WGA) and an older (37 WGA) fetus. Lower part: quiet sleep related heart rate patterns at 22 and 33 WGA. DC and AC (>10 bpm deviation from floating baseline, marked by blue *) are identified in the quiet sleep sections only.

