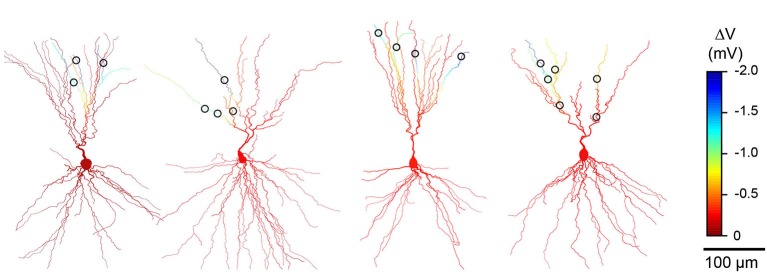
Figure 2.

Simulations consistently predict branch specific inhibition in different L3 pyramidal cells (PCs). Results from anatomical reconstructions of four additional cell pairs (as in Figure 1) showing dendritic morphology of L3 PCs and L1 interneuron synaptic contacts (circles). Color scale indicates simulated change in membrane potential during co-activation of all inhibitory synaptic contacts.
