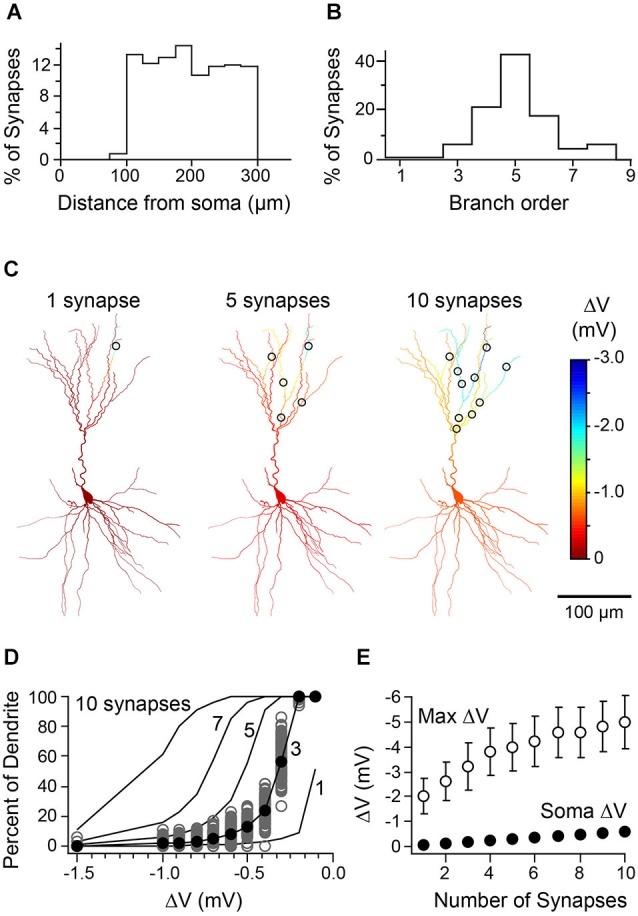
Figure 8.

Relationship between number of synaptic contacts of L1 interneuron-L3 PC pairs and distribution of inhibition. (A) Histogram representing the distance from soma for locations of synapses drawn in the model (n = 100 synapses/cell over 5 cells; compare to histogram in Figure 1C). (B) Histogram of the branch order for synapses randomly drawn from the uniform distribution represented in Figure 1D. (C) Simulated spatial profile of hyperpolarization from the activation of 1, 5, or 10 randomly placed synapses (same cell as in Figure 1). (D) Cumulative distribution curves representing mean dendritic hyperpolarization generated by 1, 3, 5, 7, or 10 synapses placed in the same cell. Gray circles, 100 iterations of 3 synapses distributed over the apical dendrites. Black circles, the mean cumulative distribution of dendritic hyperpolarization (mean of values depicted by gray circles). Black lines, mean curves generated by 100 iterations of the model. (E) Summary data from simulations of five cells showing the mean maximal dendritic voltage change (open circles) and somatic voltage change (closed circles) as a function of the number of synapses activated (error bars are < SEM).
