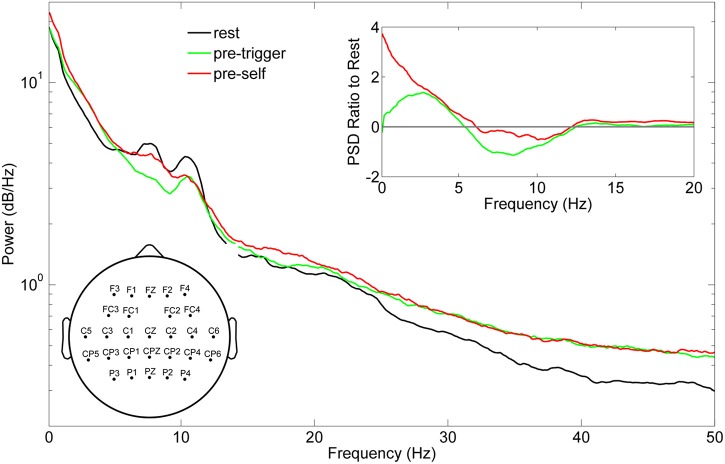
Figure 3.
Grand mean power spectral density (PSD) of EEG recordings across the 10 subjects. The PSD was computed across all channels retained for neural decoding (left inset) during quiet standing (black line) and concatenated pre-movement epochs during triggered sitting and standing (pre-trigger, green line), and concatenated pre-movement epochs during self-initiated sitting and standing (pre-self, red line). The right inset shows the ratio of pre-trigger and pre-self PSD to rest.

