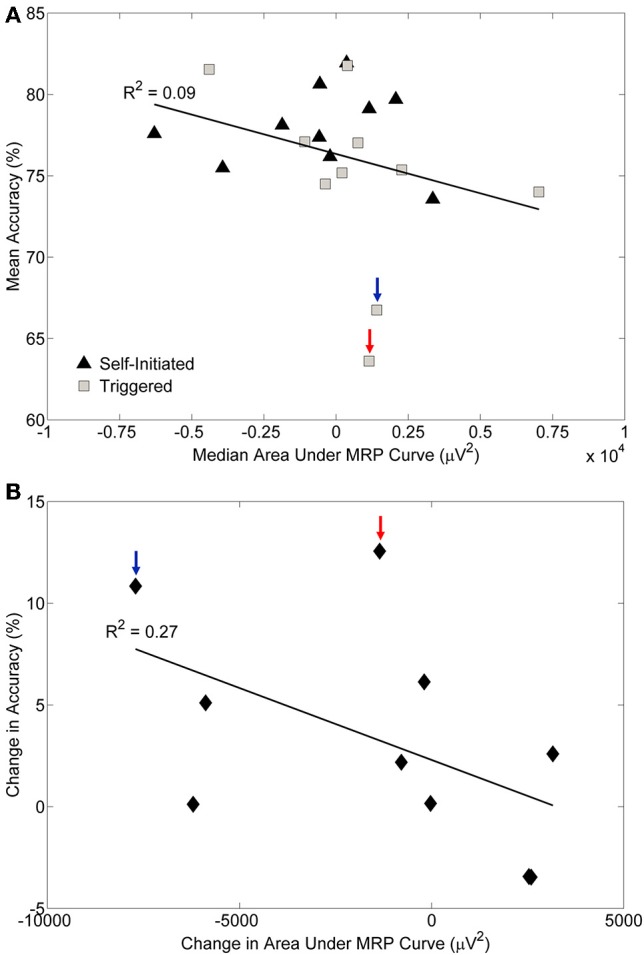
Figure 9.

Relationship between pre-movement decoding accuracy and the movement related potential (MRP). (A) The median area under the MRP curve plotted against the mean decoding accuracy for each subject and condition. A negative value of MRP area under the curve indicates the presence of larger MRPs. The coefficient of determination (R2) is indicated. (B) The change in decoding accuracy across conditions plotted against the change in area under the MRP curve for each subject. A large negative value for change in area indicates a stronger MRP presence during the self-initiated condition, while a large positive value indicates a stronger MRP presence during the triggered condition; values close to zero indicate similar MRPs for both conditions. The coefficient of determination (R2) is indicated. The two participants with the largest difference in accuracy across conditions are indicated by the arrows.
